


fig2
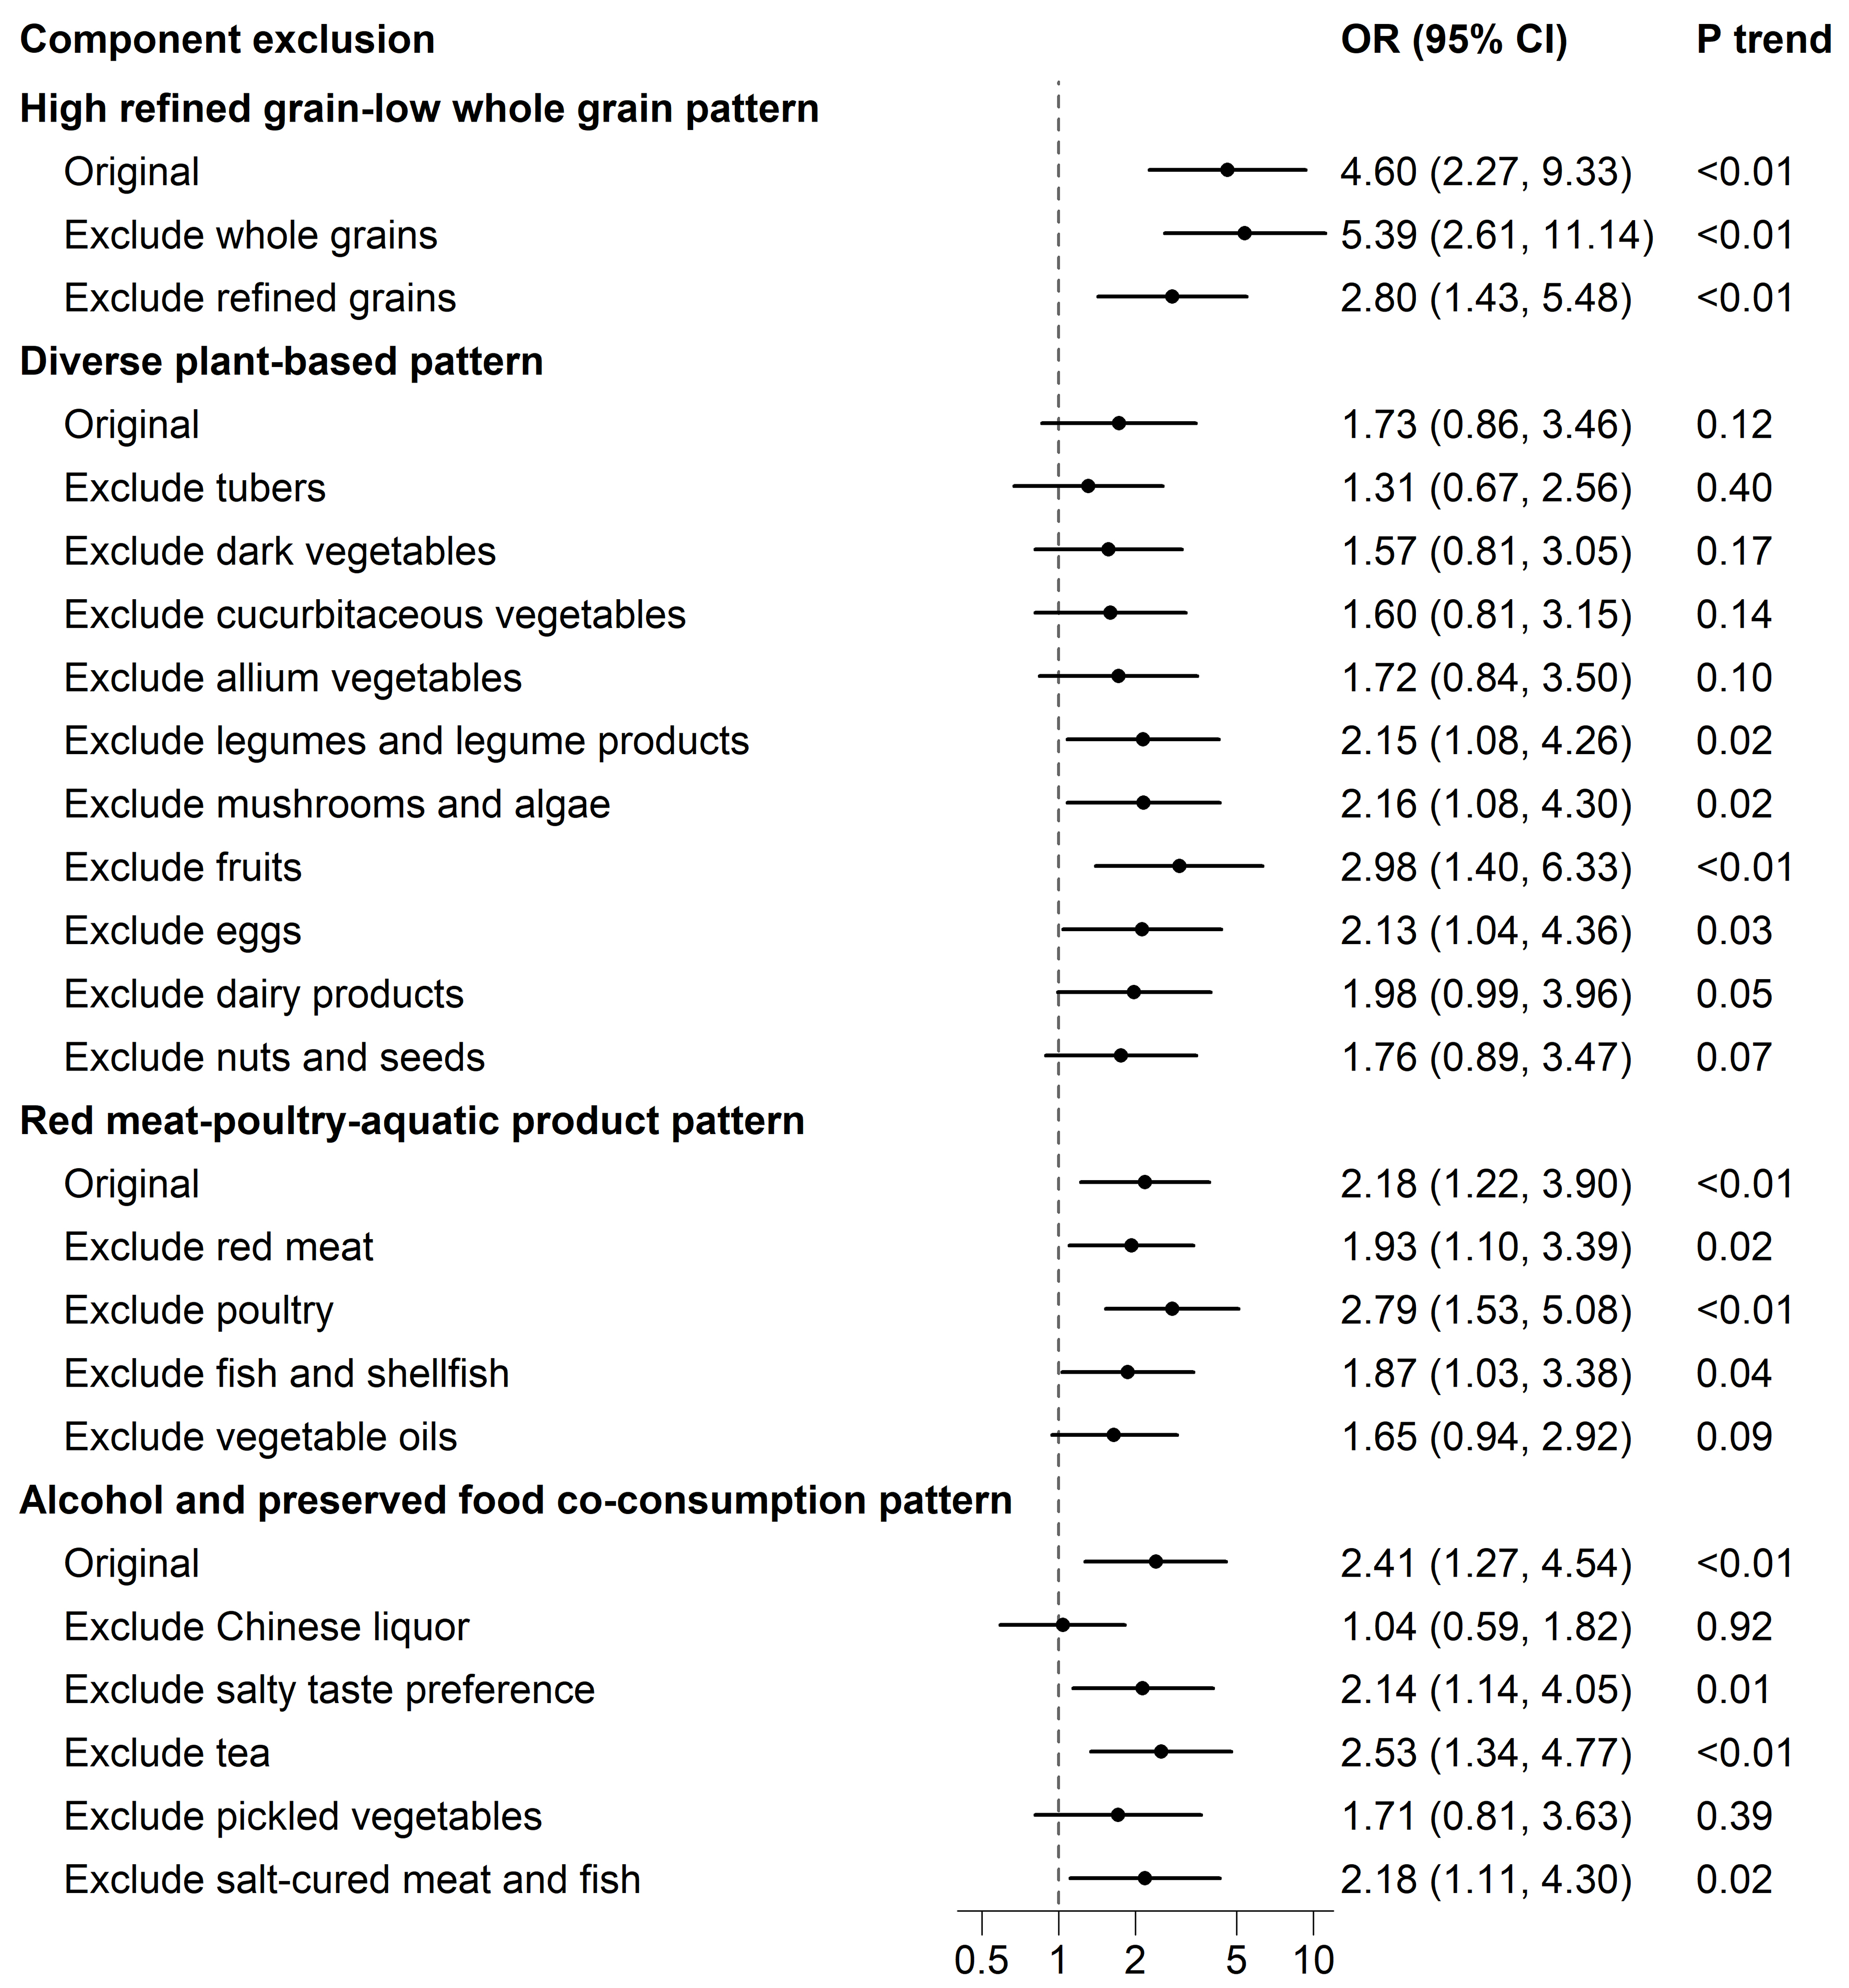
Figure 2. Forest plot of the component-exclusion sensitivity analyses for the associations between dietary pattern scores and the risk of PLC in the 1:2 matched case-control study (n = 831). The model was adjusted for education (primary school or below, junior high school, senior high school or above), annual household per capita income (< 10,000 Yuan, 10,000-20,000 Yuan, > 20,000 Yuan), energy intake (kcal/day, continuous), marital status, smoking status (never, former or current), alcohol drinking (never or light, moderate, heavy), physical activity (continuous), BMI (continuous), diabetes, HBV infection at baseline. The component exclusion approach involved iteratively recalculating the pattern scores by setting the loading of the specified food group to zero while retaining the original weights for all other loadings. The trend tests were conducted using the median value of each tertile as a continuous variable. BMI: Body mass index; OR: odds ratio; CI: confidence interval; PLC: primary liver cancer; HBV: hepatitis B virus.


