


fig7
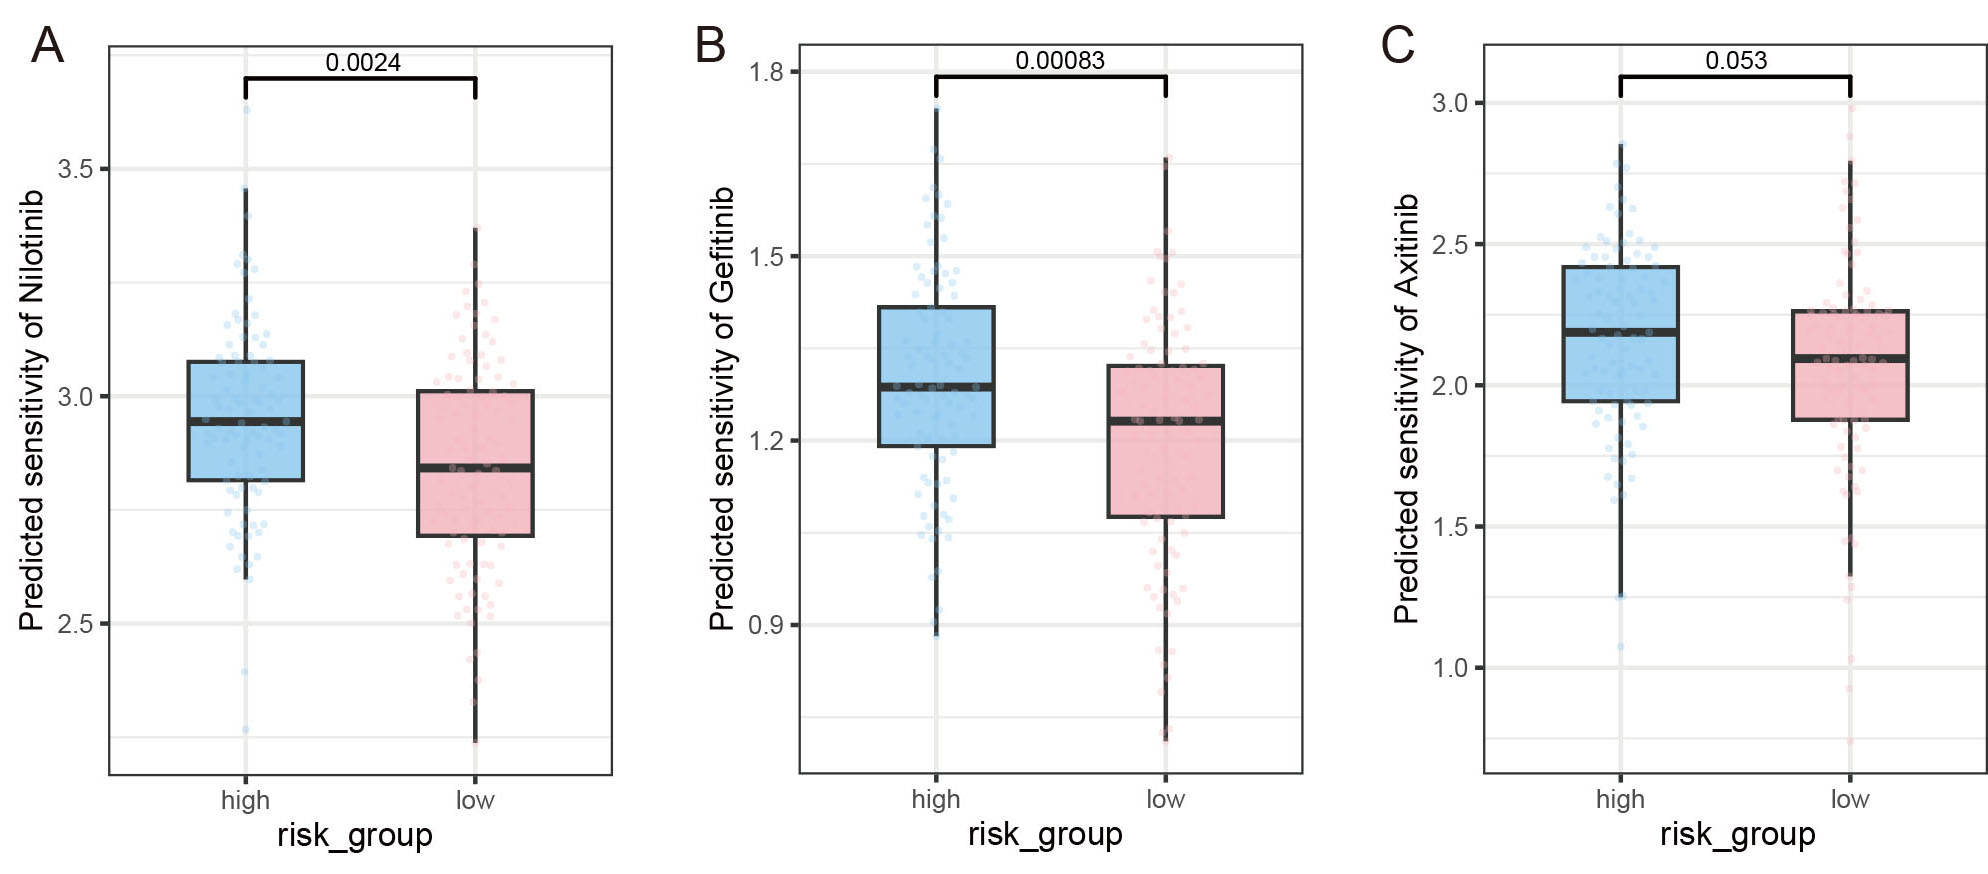
Figure 7. Sensitivities of patients in the FAMscore high and low groups to targeted agents. (A-C) Sensitivities to Nilotinib, Gefitinib, and Axitinib. The x-axis represents the grouping information, and the y-axis represents the IC50 value.
Figure 7. Sensitivities of patients in the FAMscore high and low groups to targeted agents. (A-C) Sensitivities to Nilotinib, Gefitinib, and Axitinib. The x-axis represents the grouping information, and the y-axis represents the IC50 value.


All published articles are preserved here permanently:
https://www.portico.org/publishers/oae/

