fig2

FAM gene expression predicts prognosis and immune microenvironment in microsatellite-stable colorectal cancer

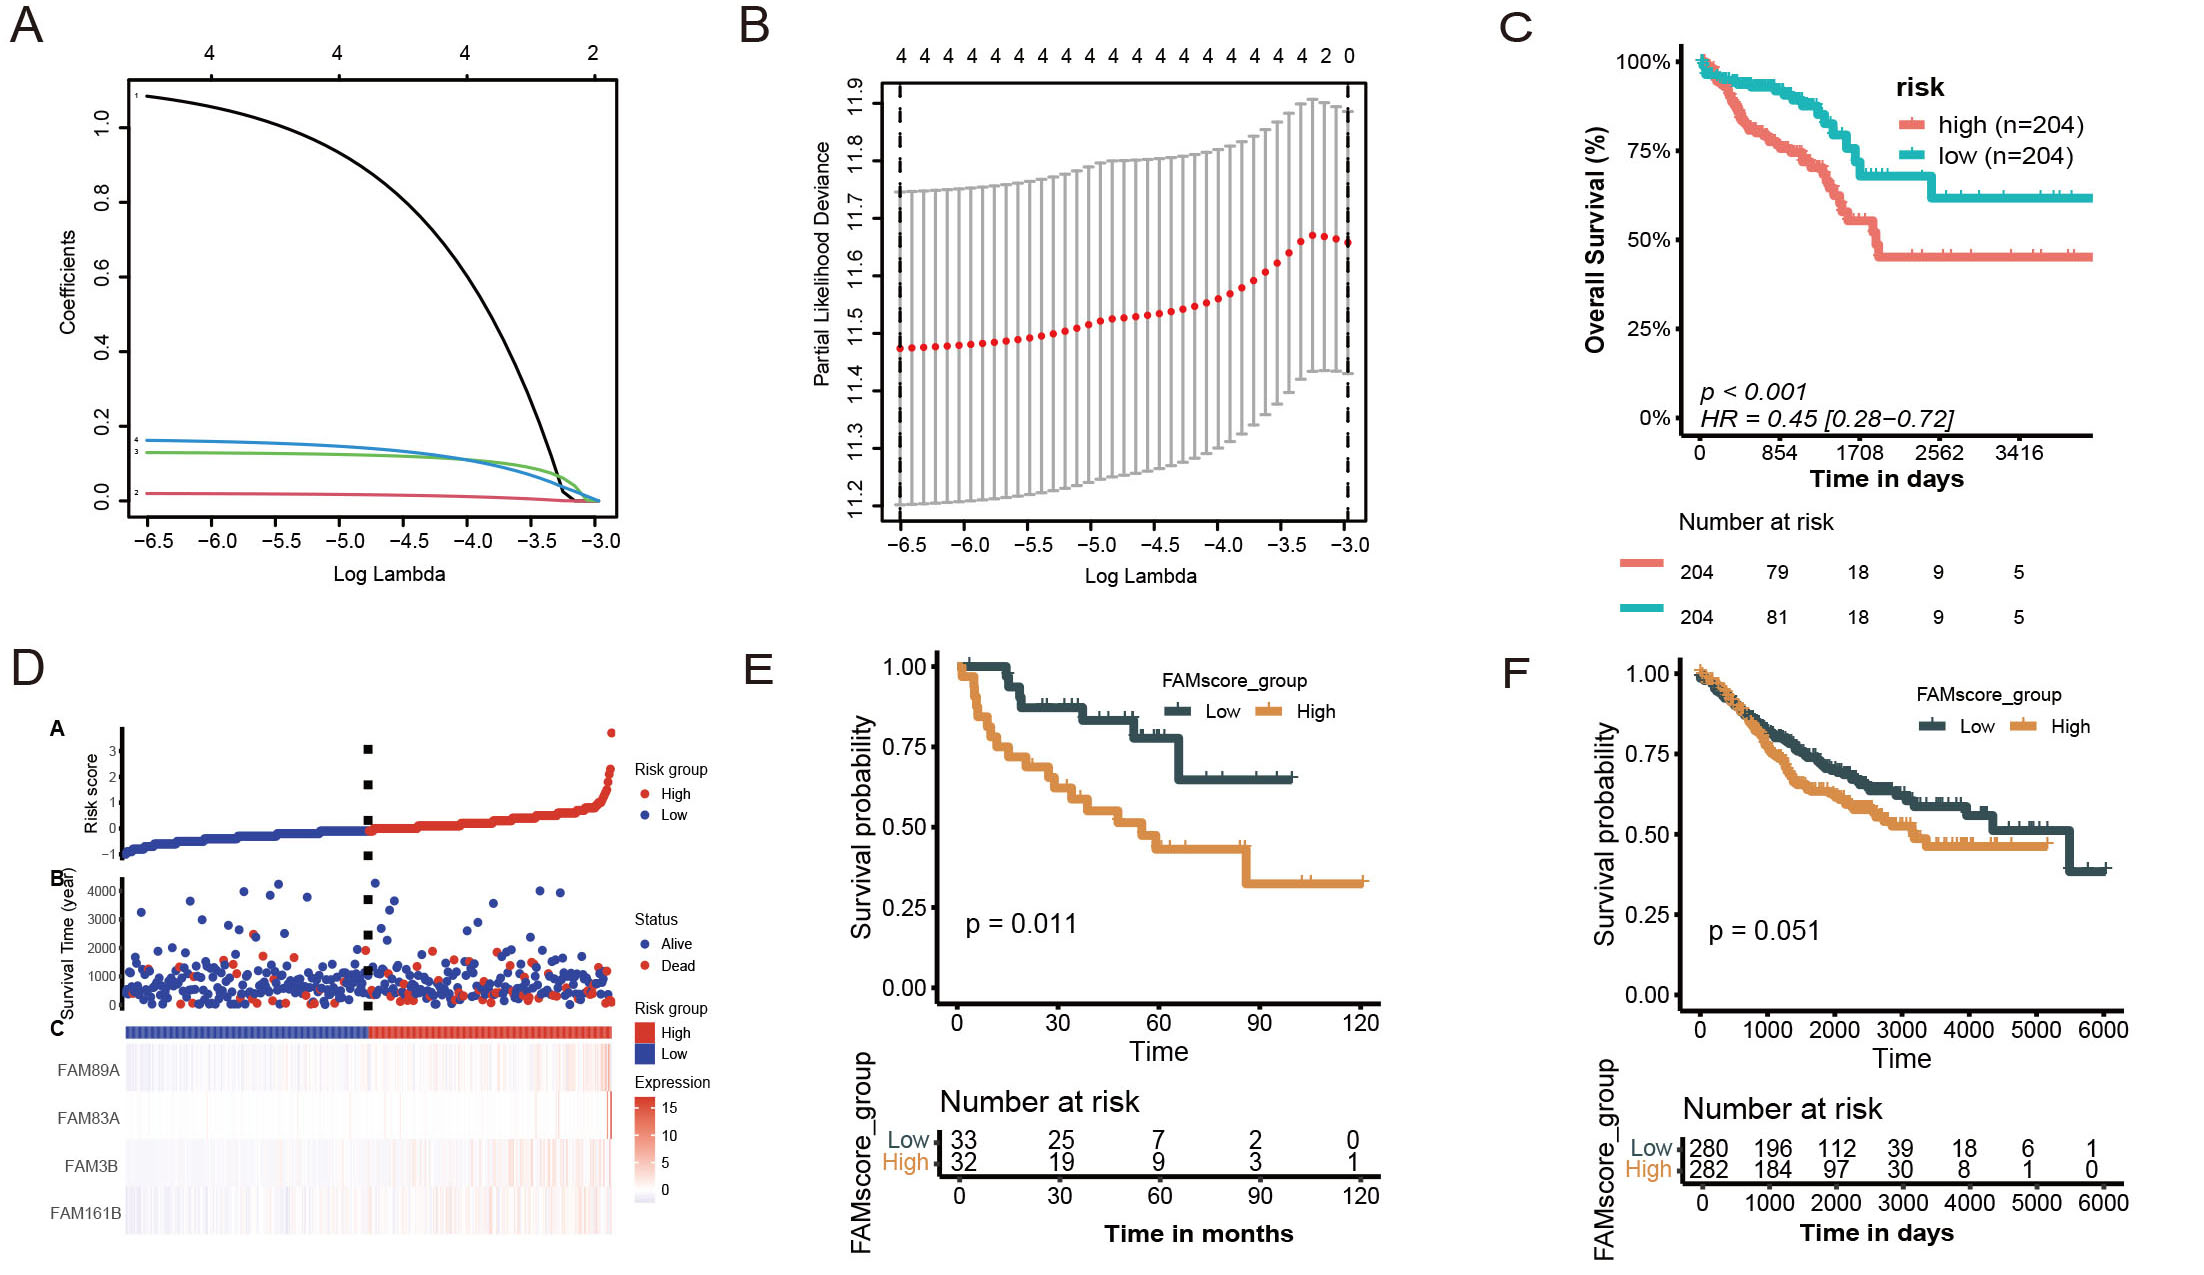
Figure 2. (A and B) Multivariate-Cox plots; (C and D) Training set results; (C) Kaplan-Meier curve of the TCGA dataset; (D) Risk factor plot; (E and F) Validation set results; (E) Kaplan-Meier curve of the GSE29623 dataset; (F) Kaplan-Meier curve of the GSE39582 dataset.

Journal of Cancer Metastasis and Treatment
ISSN 2454-2857 (Online) 2394-4722 (Print)

Portico

All published articles are preserved here permanently:

https://www.portico.org/publishers/oae/

Portico

All published articles are preserved here permanently:

https://www.portico.org/publishers/oae/