


fig1
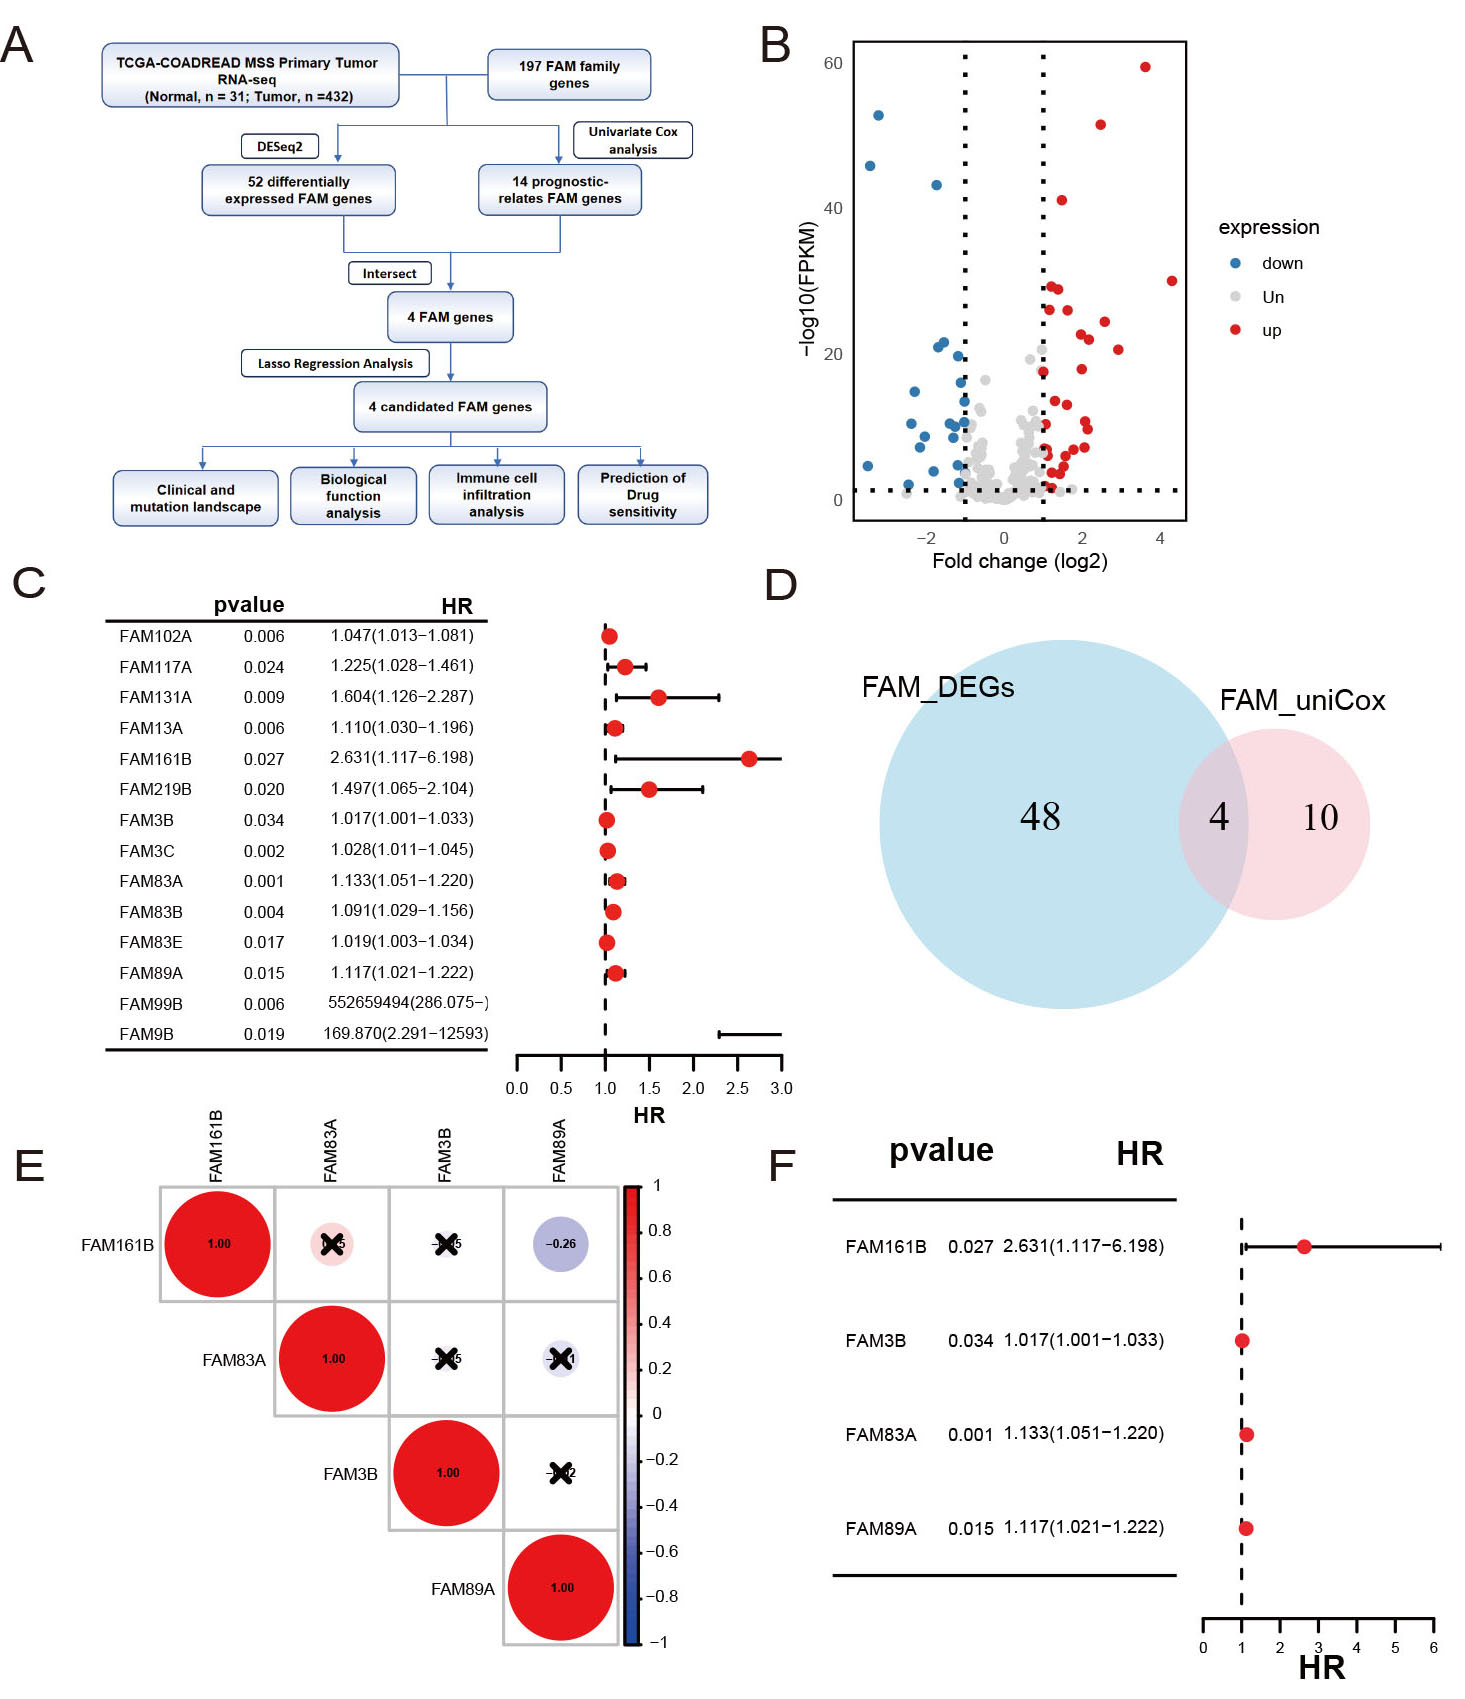
Figure 1. (A) Workflow of the study. (B) Volcano plot of differentially expressed FAM gene family members between tumor and normal tissues. (C) Forest plot of prognosis-related FAM genes. (D) Venn diagram showing the intersection between differentially expressed genes and prognosis-related FAM genes. (E) Heatmap of correlations among the four FAM genes. (F) Forest plot of the intersection FAM genes.


