


fig6
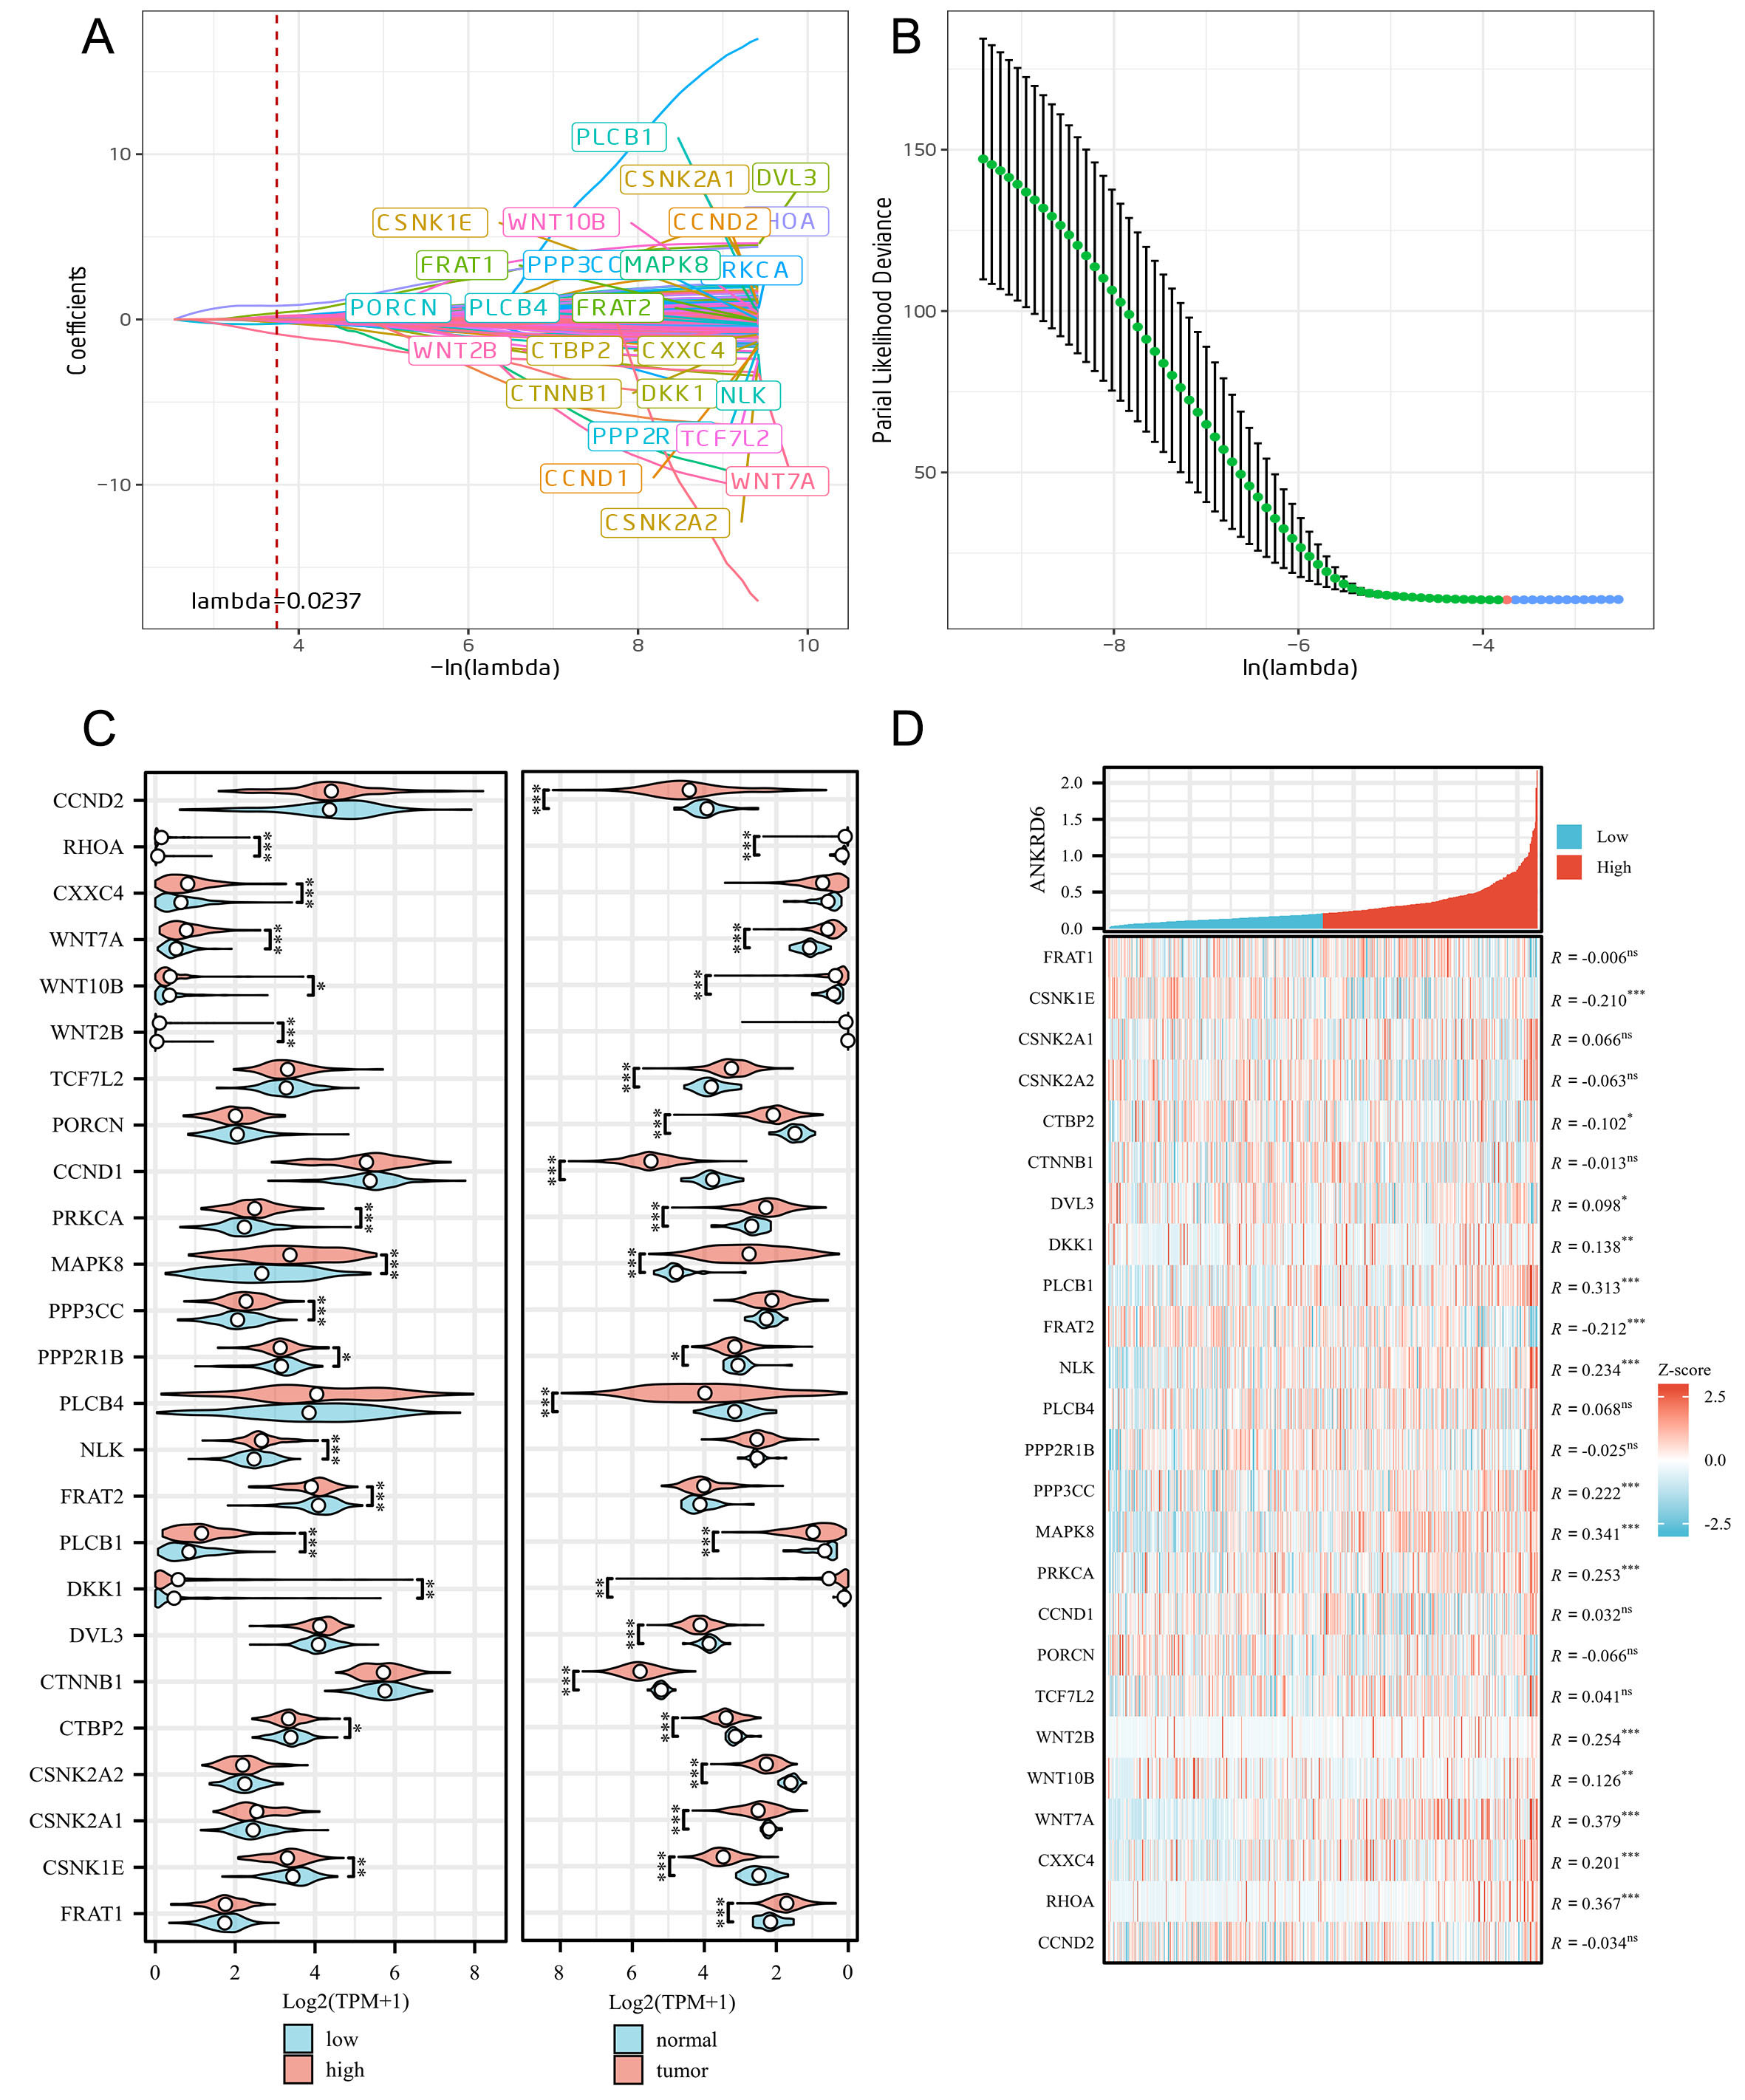
Figure 6. LASSO regression analysis and gene expression differences in tumor and normal tissues. (A) LASSO regression coefficient path showing the changes in regression coefficients for 151 KEGG_WNT_SIGNALING_PATHWAY genes at different λ values. The red dashed line represents the optimal λ value (0.0237). (B) Selection of the optimal λ value, determined by the minimum point of partial likelihood deviance, represented by a vertical line. Error bars indicate standard error. (C) Violin plots comparing the expression of the 25 survival-related genes in two contexts: left panel - high vs. low ANKRD6 expression groups (red: high, blue: low); right panel - tumor vs. normal tissues (red: tumor, blue: normal). This layout highlights how these genes vary with ANKRD6 expression status and tumorigenesis. (D) Correlation analysis between ANKRD6 expression and the 25 genes. The heatmap illustrates gene expression Z-scores, where positive correlations are shown in red and negative correlations in blue. The figure reports correlation coefficients (R) along with statistical significance. (ns: Not significant; *P < 0.05; **P < 0.01; ***P < 0.001).


