


fig7
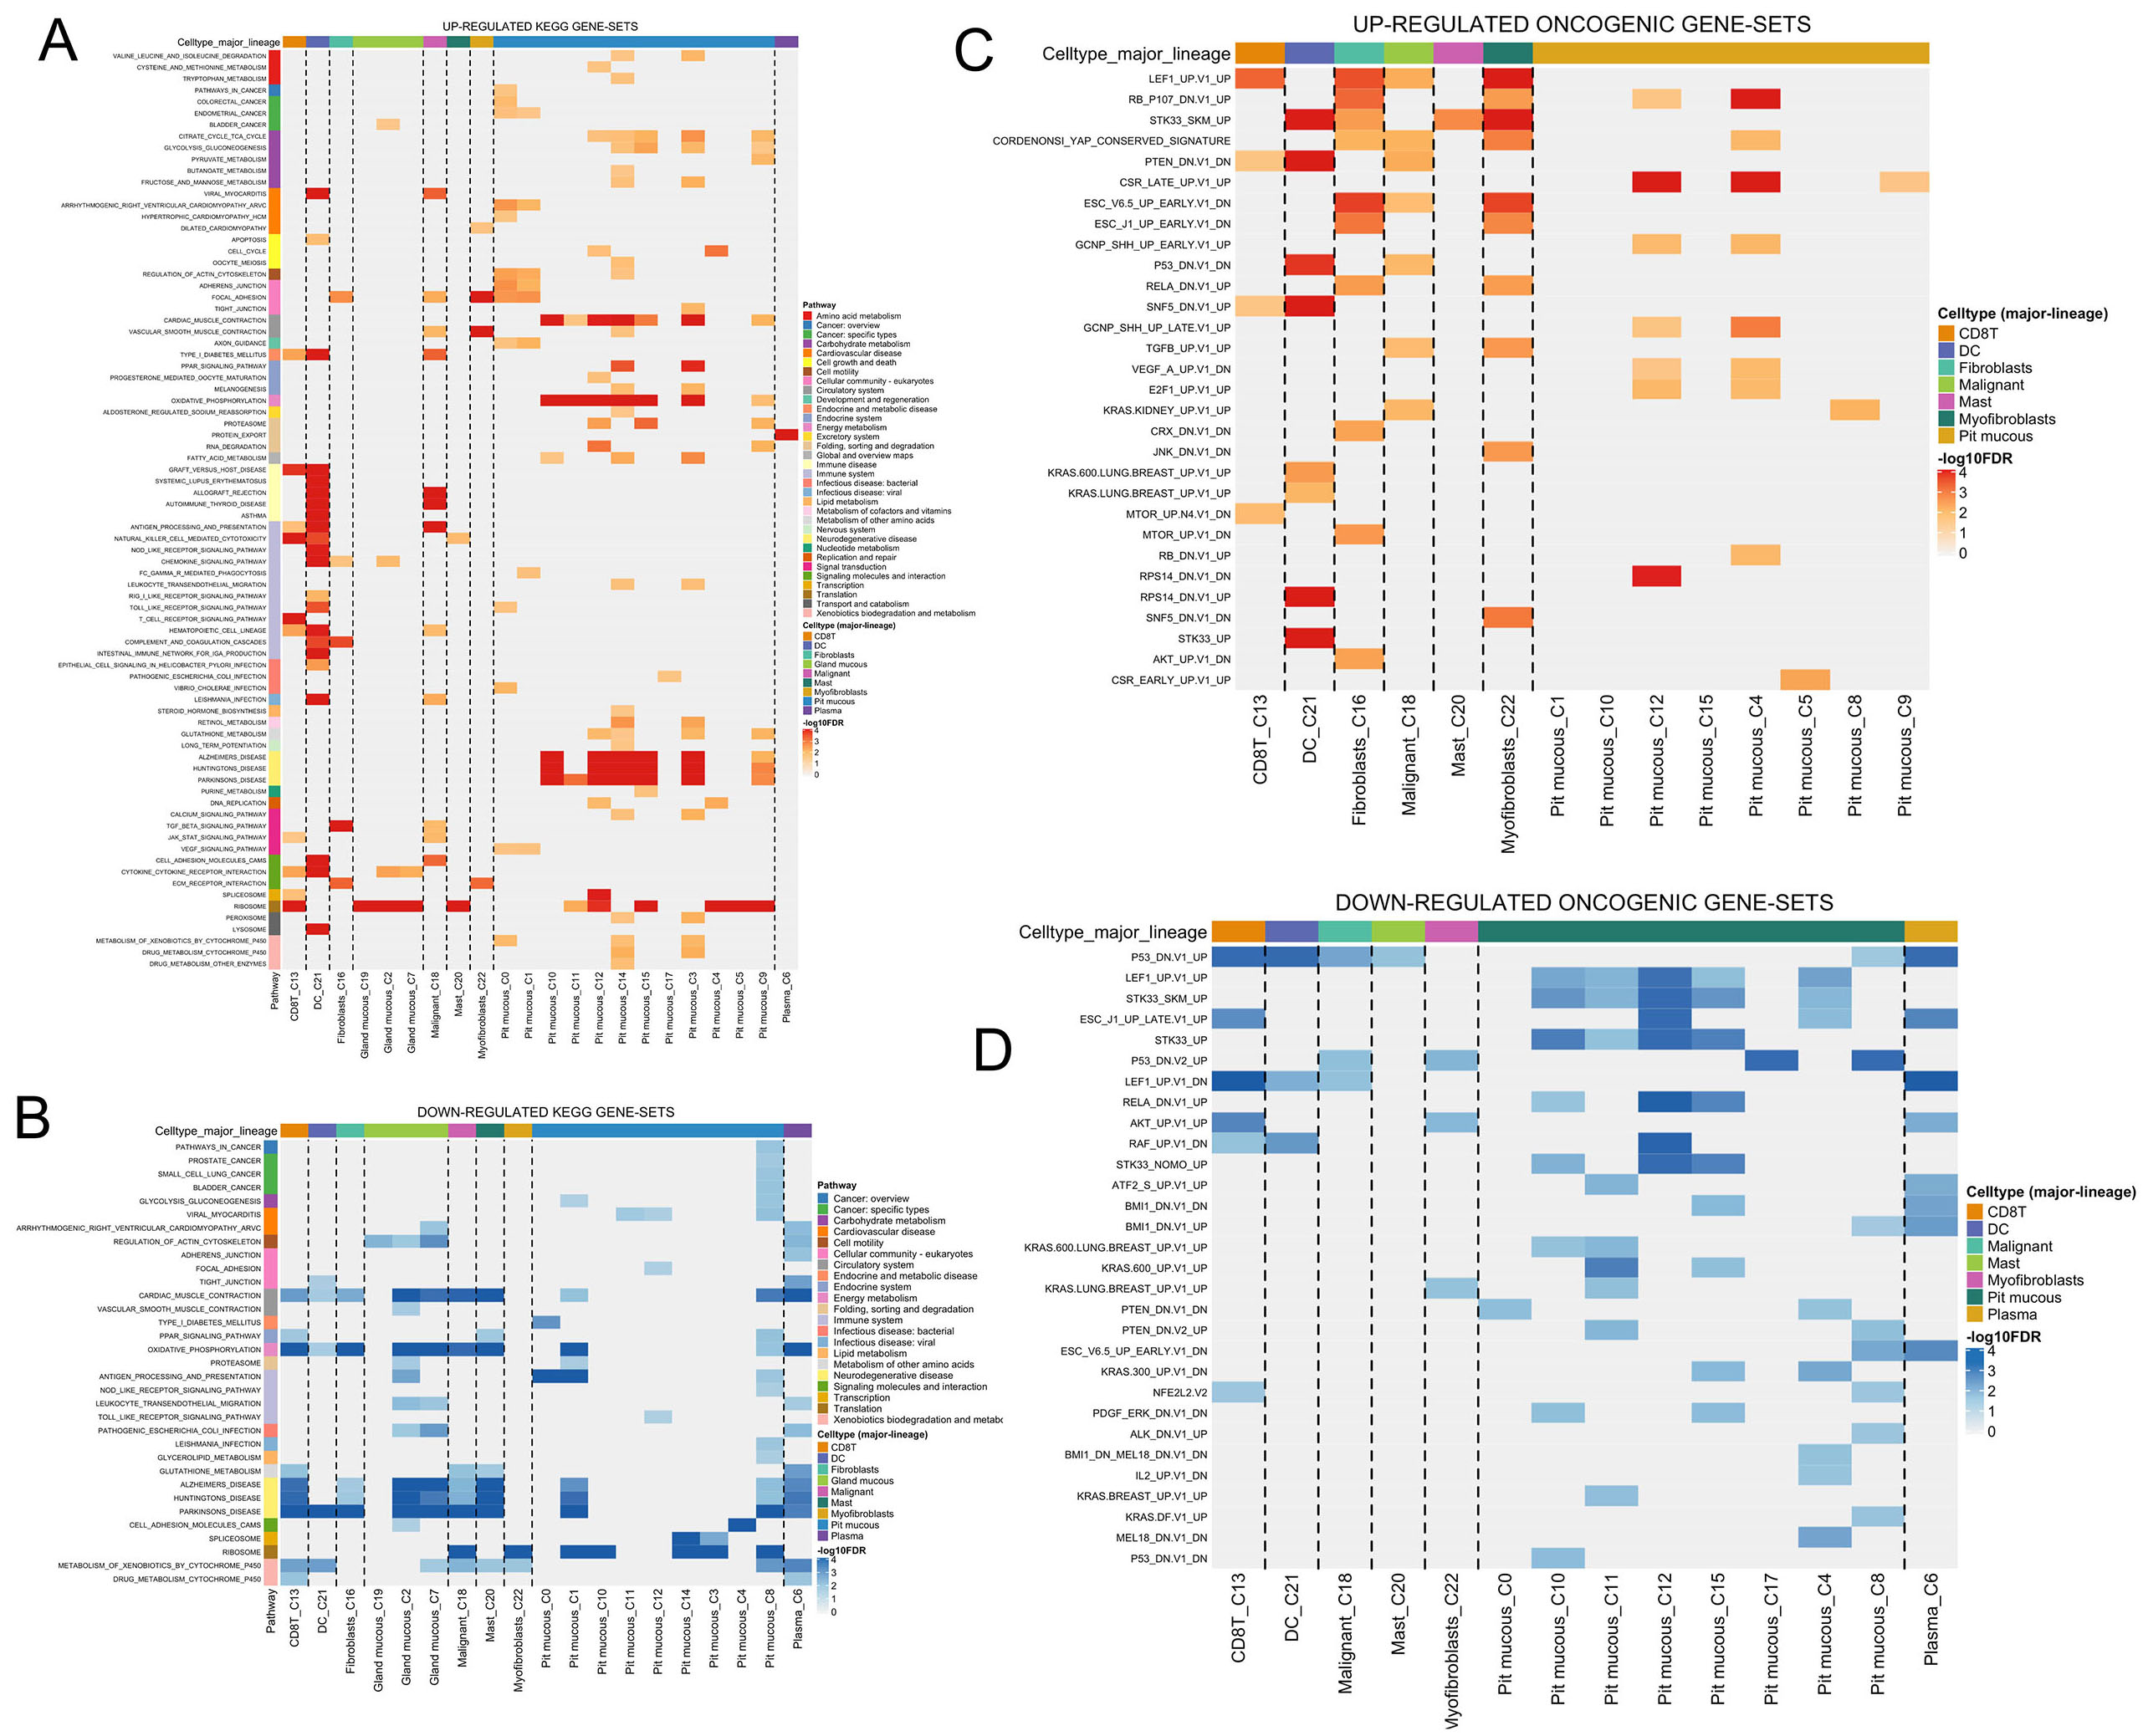
Figure 7. Hallmark and Oncogenic gene set enrichment analysis in CHST14-expressing clusters of STAD_GSE134520. (A) Heatmap of upregulated hallmark gene sets across cell types and clusters, highlighting enriched pathways such as “Epithelial-Mesenchymal Transition”, “Hypoxia”, and “TNF-α Signaling via NF-κB” in CHST14-high clusters (16 and 18). (B) Heatmap of downregulated hallmark gene sets, showing reduced activity in pathways like “Oxidative Phosphorylation” and “Fatty Acid Metabolism” in CHST14-high clusters. (C) Heatmap of upregulated oncogenic gene sets across cell types and clusters, showing enrichment of pathways such as “PI3K/AKT/mTOR signaling”, “MYC targets”, and “KRAS signaling” in CHST14-high clusters (16 and 18). (D) Heatmap of downregulated oncogenic gene sets, highlighting the suppression of pathways such as “p53 signaling” and “PTEN signaling” in CHST14-high clusters.


