


fig3
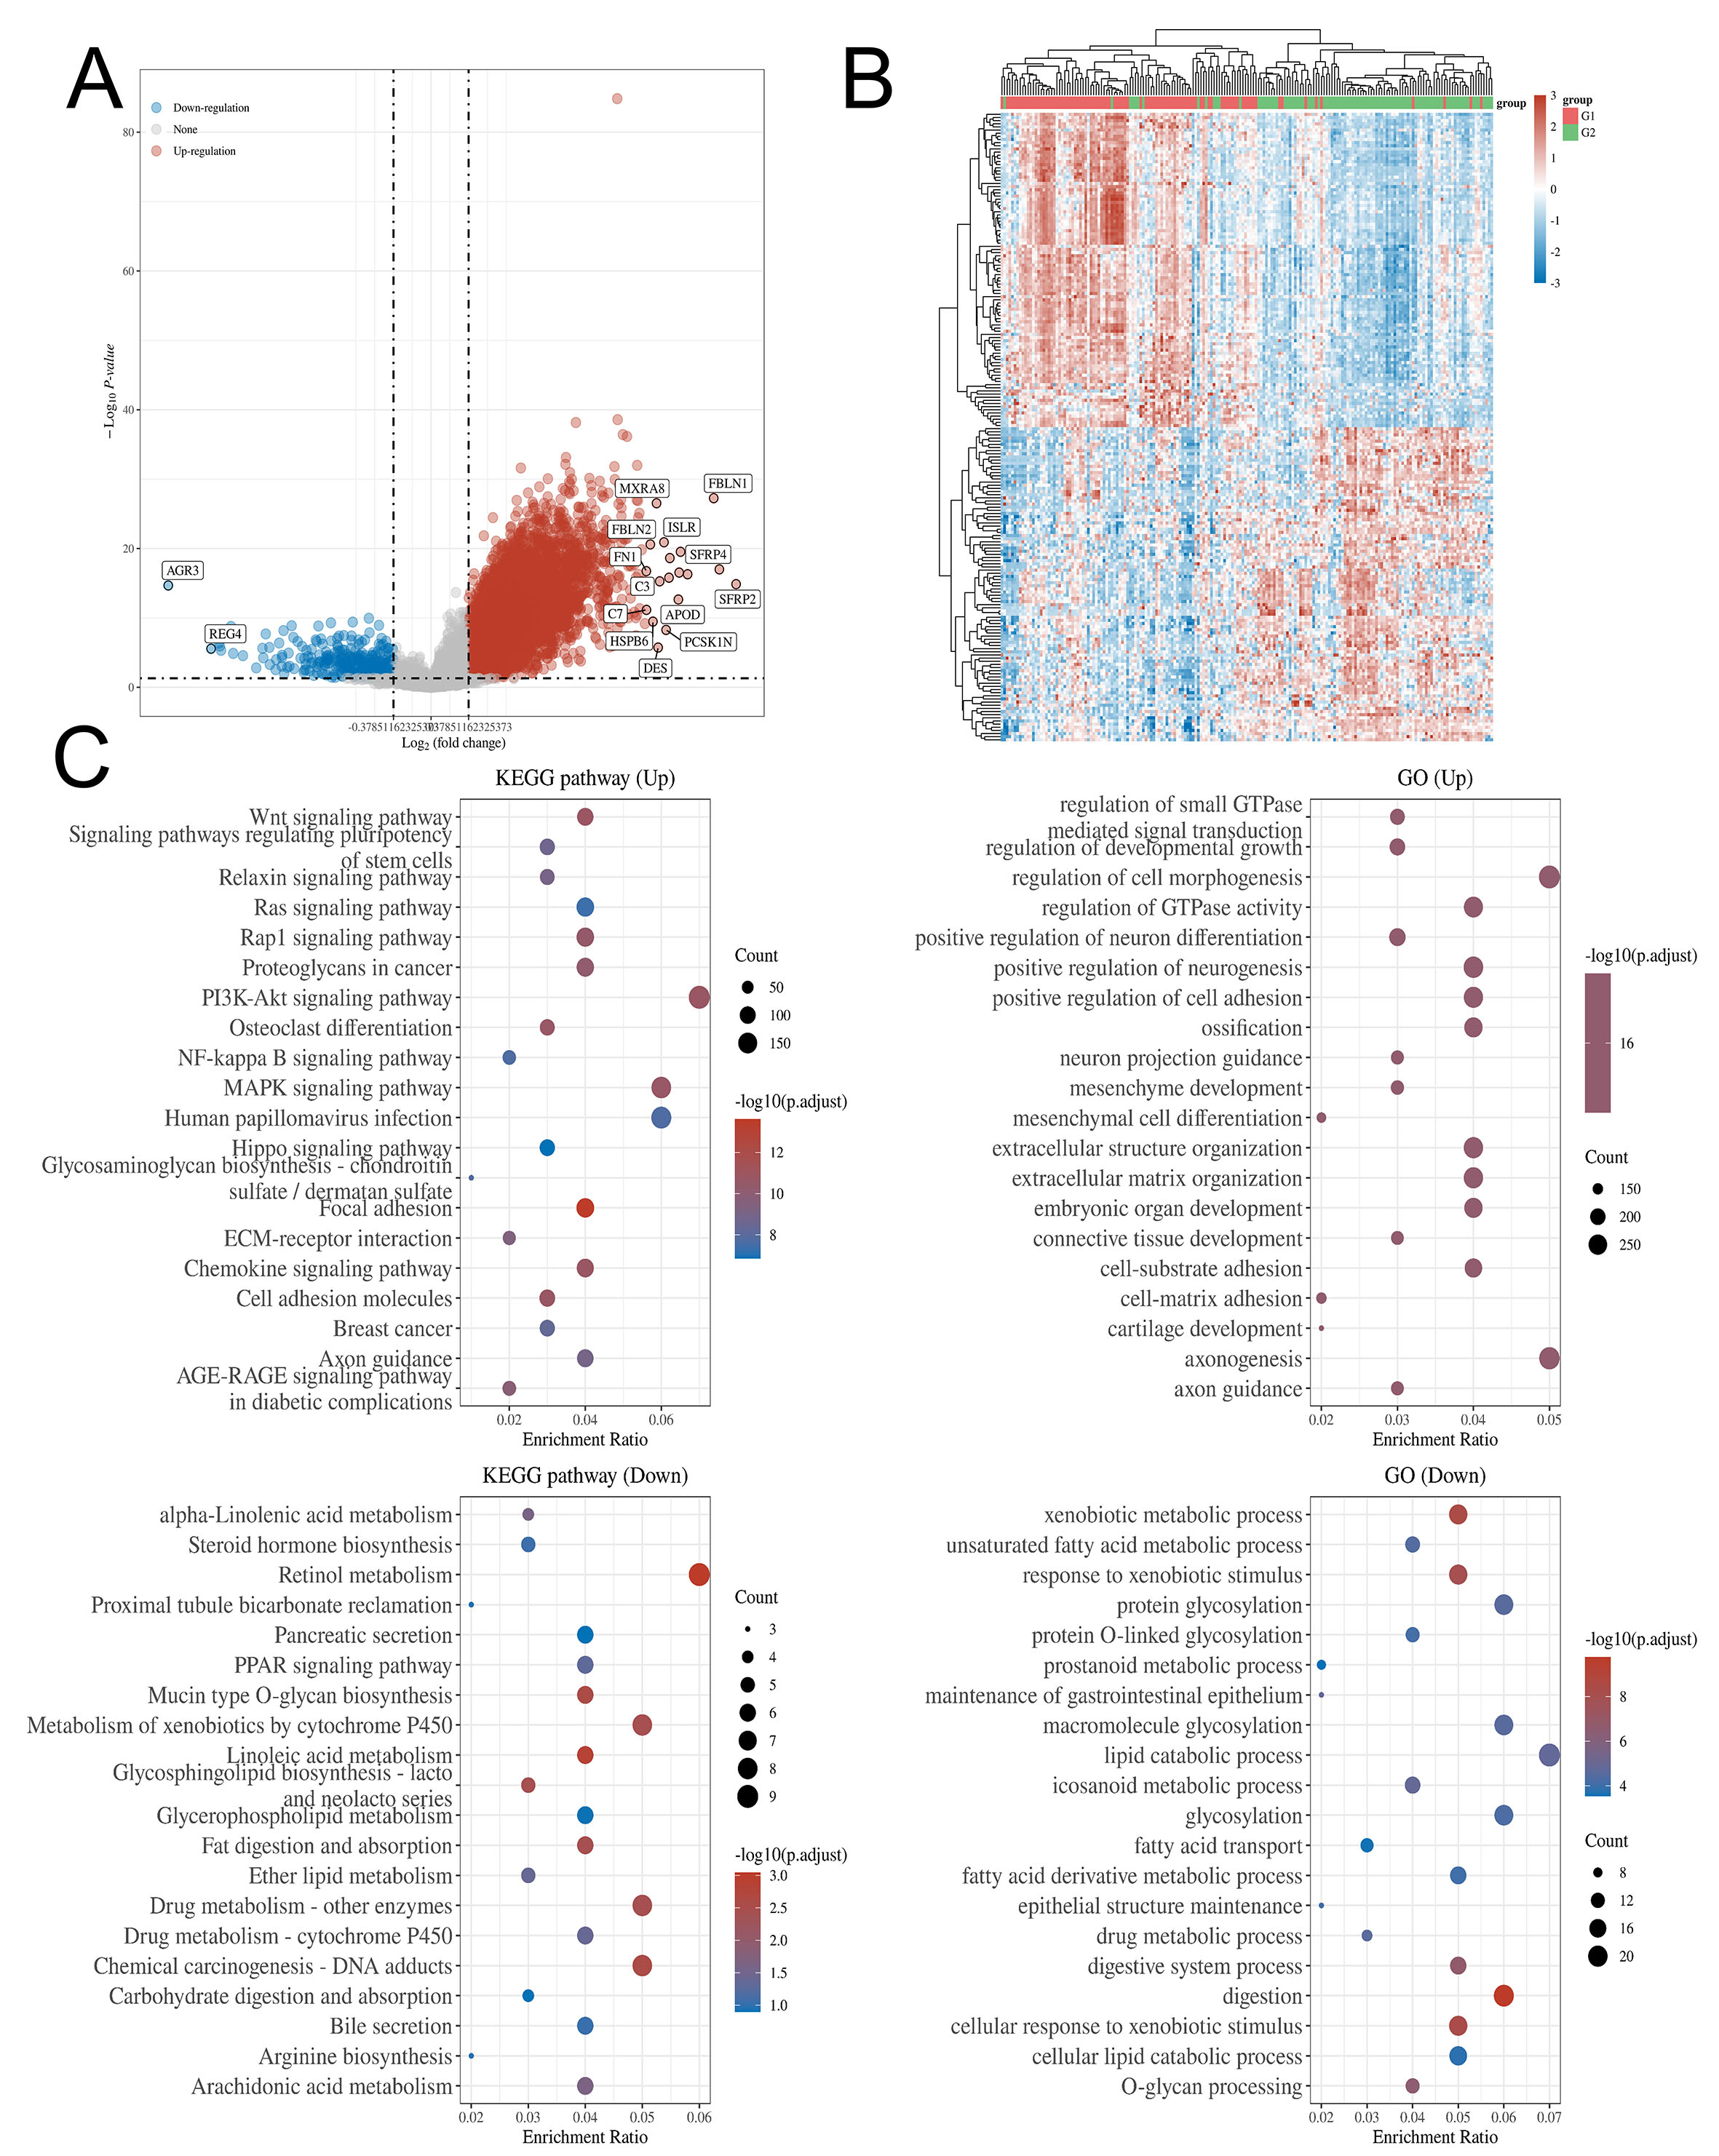
Figure 3. GO and KEGG enrichment analysis of CHST14-related genes in gastric cancer. Based on the TCGA-STAD cohort, samples were divided into CHST14-high (75%-100%) and CHST14-low (0%-25%) groups, using a fold-change cut-off of > 1.3 and a P-value < 0.05. (A) Volcano plots of CHST14-related genes. Red dots indicate upregulated CHST14-related genes, while blue dots indicate downregulated CHST14-related genes. (B) Heatmap and hierarchical clustering analysis of CHST14-related genes. (C) GO and KEGG enrichment pathways of CHST14-related genes. GO: Gene ontology; KEGG: kyoto encyclopedia of genes and genomes; TCGA-STAD: the cancer genome atlas-stomach adenocarcinoma.


