


fig1
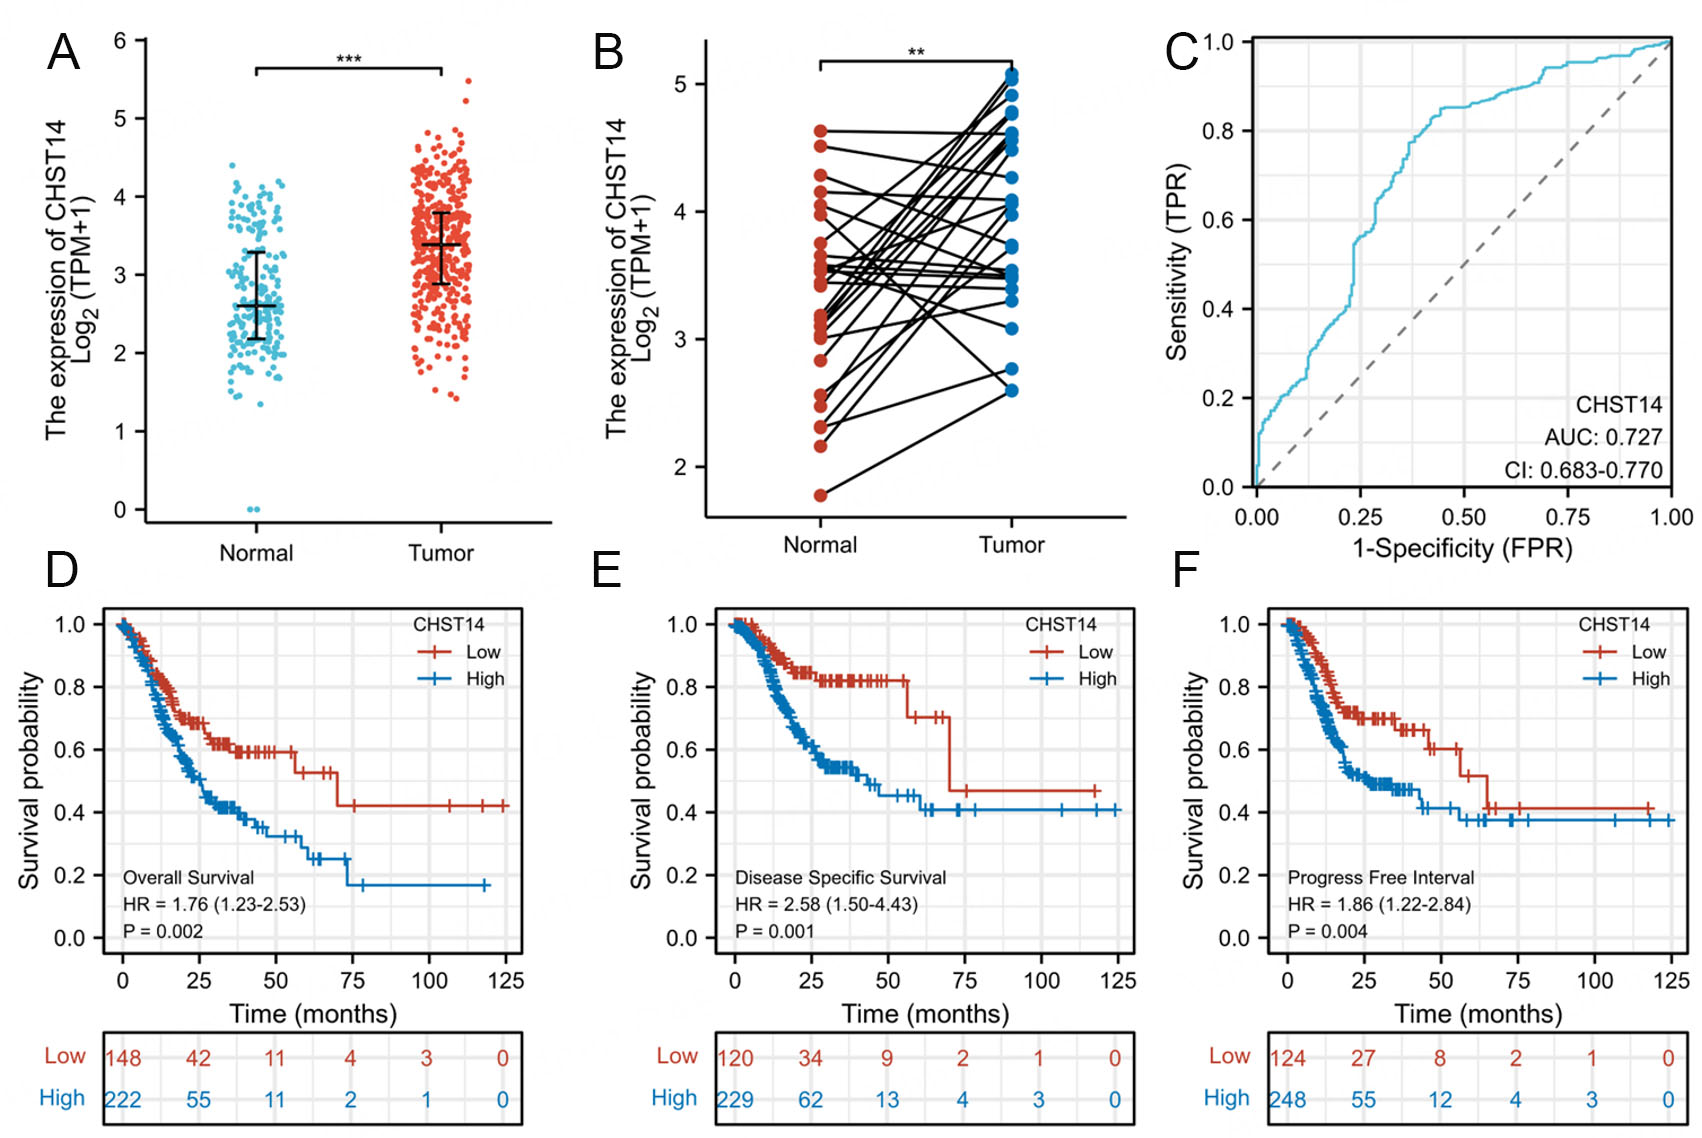
Figure 1. CHST14 as a diagnostic and prognostic biomarker in gastric cancer. Analysis was performed using the TCGA-STAD cohort. (A) CHST14 mRNA expression levels were compared between the TCGA-STAD cohort and the GTEx database. (B) CHST14 mRNA expression levels were compared between gastric cancer tissues and corresponding paired normal tissues from the TCGA-STAD cohort. (C) The diagnostic ROC curve of CHST14 in gastric cancer was generated using data from the TCGA STAD cohort and the GTEx database. Based on the TCGA-STAD cohort, KM plots were constructed for overall survival (D), disease-specific survival (E), and progression-free interval (F) in GC. Differences between the CHST14-high and CHST14-low groups were assessed using log-rank tests, with the cut-off value determined to minimize the P-value. TCGA-STAD: The cancer genome atlas-stomach adenocarcinoma; GTEx: genotype-tissue expression; ROC: receiver operating characteristic; KM: kaplan-meier; GC: gastric cancer. *P < 0.05; **P < 0.01; ***P < 0.001.


