



Computational modelling of cerebrospinal fluid flow in a translational canine model
 0
0 
Abstract
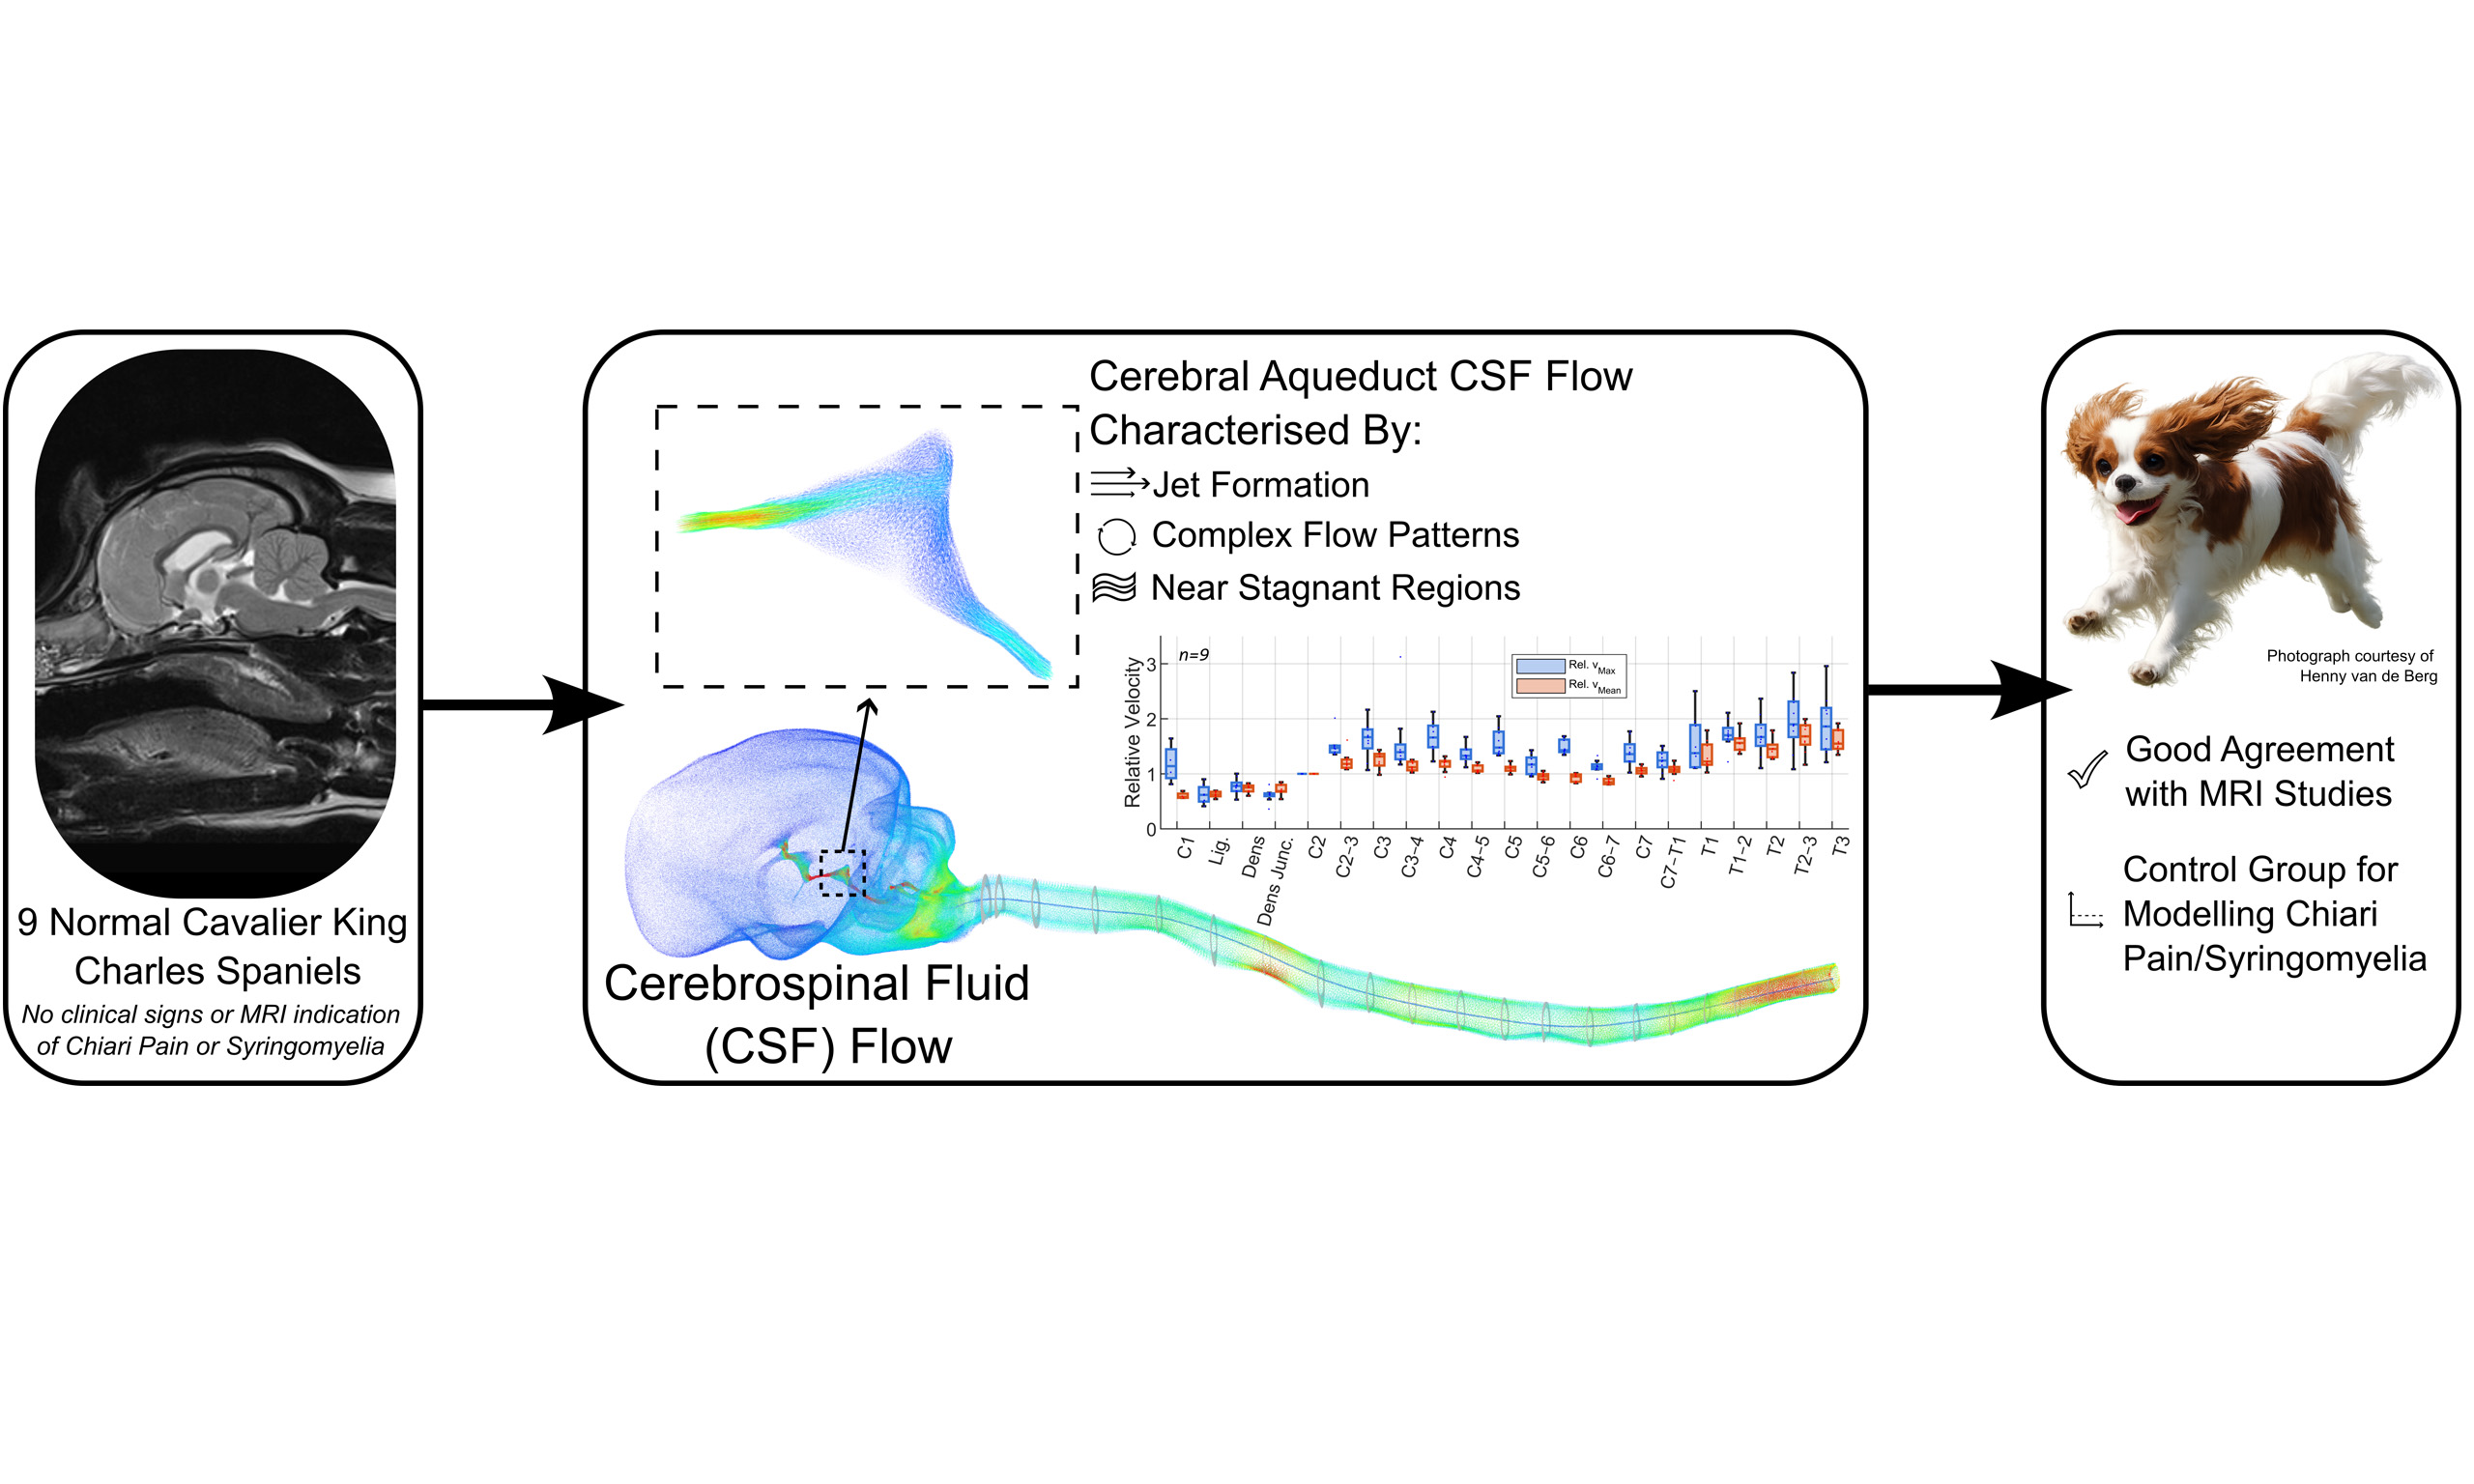
Aim: Chiari malformation and syringomyelia are disorders of cerebrospinal fluid (CSF) dynamics, yet translation of mechanistic insights into patient care is limited by the low prevalence and heterogeneity of human disease, and by methodological constraints of
Methods: Retrospective MRI data from nine clinically normal CKCS were used to construct subject-specific craniospinal CSF geometries. CFD simulations yielded cardiac-driven oscillatory CSF motion under physiologically plausible boundary conditions, incorporating spinal compliance and zero net flow per cardiac cycle to characterize velocities and pressures.
Results: Simulations revealed pulsatile, laminar CSF flow with pronounced regional heterogeneity, dominant subarachnoid space (SAS) transport, complex flow patterns within the cerebral aqueduct, and a cycle-dependent pressure difference between the central canal and SAS with marked sensitivity to anatomical location and downstream spinal geometry.
Conclusion: These findings demonstrate that local anatomy strongly influences measured CSF velocities, limiting the translational reliability of isolated in vivo measurements while supporting CFD as a more robust framework for clinically meaningful interpretation. Establishing these baseline craniospinal flow characteristics provides a necessary reference for interpreting clinical CSF measurements and for extending computational analyses to dogs with Chiari-like malformation and syringomyelia.
Keywords
INTRODUCTION
Chiari malformation and syringomyelia are neurological disorders associated with cerebrospinal fluid (CSF) flow abnormalities which can lead to pain and neurological dysfunction. Studying CSF dynamics in affected human populations is limited by the low incidence and phenotypic variability of these conditions. In pediatric patients, type 1 Chiari malformation affects approximately 0.1% of the population, with concurrent syringomyelia present in about 30% of those cases[1]. Population-level estimates are lower in Italy (0.008% for Chiari malformation and 0.005% for syringomyelia[2]) and syringomyelia incidence in the Russian Federation is around 0.01%[3], possibly reflecting regional familial predisposition.
In contrast, Chiari-like malformation, a naturally occurring analogue of human Chiari I malformation in dogs, and syringomyelia are highly prevalent and less phenotypically variable in the Cavalier King Charles Spaniel (CKCS). The incidence of Chiari-like malformation and syringomyelia in the CKCS ranges between 77%-100% and 15%-79%, depending on the population examined, exclusion criteria, etc. Although the statistical power of these studies is limited, these data show a significantly higher prevalence compared to humans, and increasing incidence with age[4]. These high rates are linked to artificial selection for neotenous and brachycephalic cranial conformation, which reduces the volume of the cranial fossa and promotes neuroparenchymal overcrowding, especially at the cranio-cervical junction. Because these conditions arise spontaneously in the CKCS and share key pathophysiological features with the human disease, including posterior/caudal fossa crowding, altered craniospinal compliance, and syrinx formation, this canine breed has been proposed as a clinically relevant translational model for investigating disrupted CSF dynamics; providing access to a large volume of clinically acquired magnetic resonance imaging (MRI) data from affected CKCS which can be leveraged to study CSF flow. Our group alone has a dataset of hundreds of existing MRI sequences from which fluid simulations can be initiated. CKCS serve not only as experimental models, but also as clinical patients, such that mechanistic insights derived from this population have direct implications for veterinary diagnosis, surgical planning, and outcome assessment. To date, only 2 studies have modelled CSF flow in dogs[5,6]; however, these primarily addressed mechanical stress in the spinal cord rather than the characterization of CSF flow patterns.
The use of dogs as translational models for CSF associated conditions is well established in comparable conditions. Early hydrocephalus experimental work relied heavily on canine models as their gyrification, ventricular anatomy, and size permitted direct surgical manipulation and physiological measurement that was comparable to humans. The first reproducible models of hydrocephalus are generally attributed to Walter Dandy and Kenneth Blackfan, who induced ventricular enlargement in dogs by obstructing CSF pathways and thereby demonstrated that hydrocephalus could be produced through interference with CSF circulation[7-9].
Due to their gyrencephalic brains and size, dogs also served as key translational models for evaluating CSF diversion procedures, allowing implantation of shunt systems and assessment of long-term outcomes. Becker and Nulsen, 1968 used experimental dog models to evaluate valve-regulated ventriculo-venous shunts, demonstrating that pressure-controlled drainage improved long-term shunt function and reduced complications such as over-drainage and venous reflux[10]. These principles were translated to veterinary patients, including ventriculo-atrial shunting in dogs[11].
In addition to hydrocephalus, experimental work in dogs has been central to shaping modern concepts of syringomyelia as a disorder of CSF hydrodynamics and pressure transmission. One of the earliest reproducible large-animal models was described by Williams and Weller (1973), who produced syrinx-like cavities through intramedullary injection of CSF or saline in beagles. The development of these cavities supported a hypothesis through which fluid under pressure dissects through mechanically vulnerable regions of the spinal cord and may communicate secondarily with the central canal rather than arising from primary canal dilation[12].
In contrast to syringomyelia and hydrocephalus, no equivalent experimentally derived canine translational models have been systematically developed for human Chiari malformation, however, there is sustained clinical interest in the translational relevance of naturally occurring Chiari-like malformation and syringomyelia in dogs. Particularly given the anatomical, pathophysiological, and imaging parallels with the comparable human conditions. Veterinary neurologists and researchers have regularly contributed to multidisciplinary clinical and scientific meetings such as the British Chiari Syringomyelia Group, reflecting recognition of the translational relevance of veterinary research[13].
CSF flow in the craniospinal system is inherently pulsatile, exhibiting periodic variations in velocity and direction driven primarily by the cardiac cycle[4]. In dogs, CSF circulates through a ventricular system that is continuous with the subarachnoid space (SAS), with caudal displacement during systole and rostral return during diastole. The anatomy of this system is shown in Figure 1. Several anatomical features distinguish the canine system from that of humans and are relevant to CSF hydrodynamics, including a patent central canal throughout the spinal cord, the absence of cerebellar tonsils, and the absence of the foramen of Magendie. The volume of CSF displaced into the spinal SAS depends in part on the compliance of the spinal dura mater[14]; a measure of volumetric change per unit of applied pressure. These features collectively shape craniospinal coupling in dogs and must be accounted for when characterizing CSF flow dynamics. Additional CSF circulation is facilitated through the parenchyma via the glymphatic system and intramural peri-arterial drainage system; the examination of which is outside of the scope of this study. For a more comprehensive discussion of CSF anatomy, physiology, and flow in dogs, readers are referred to our recent review[4].
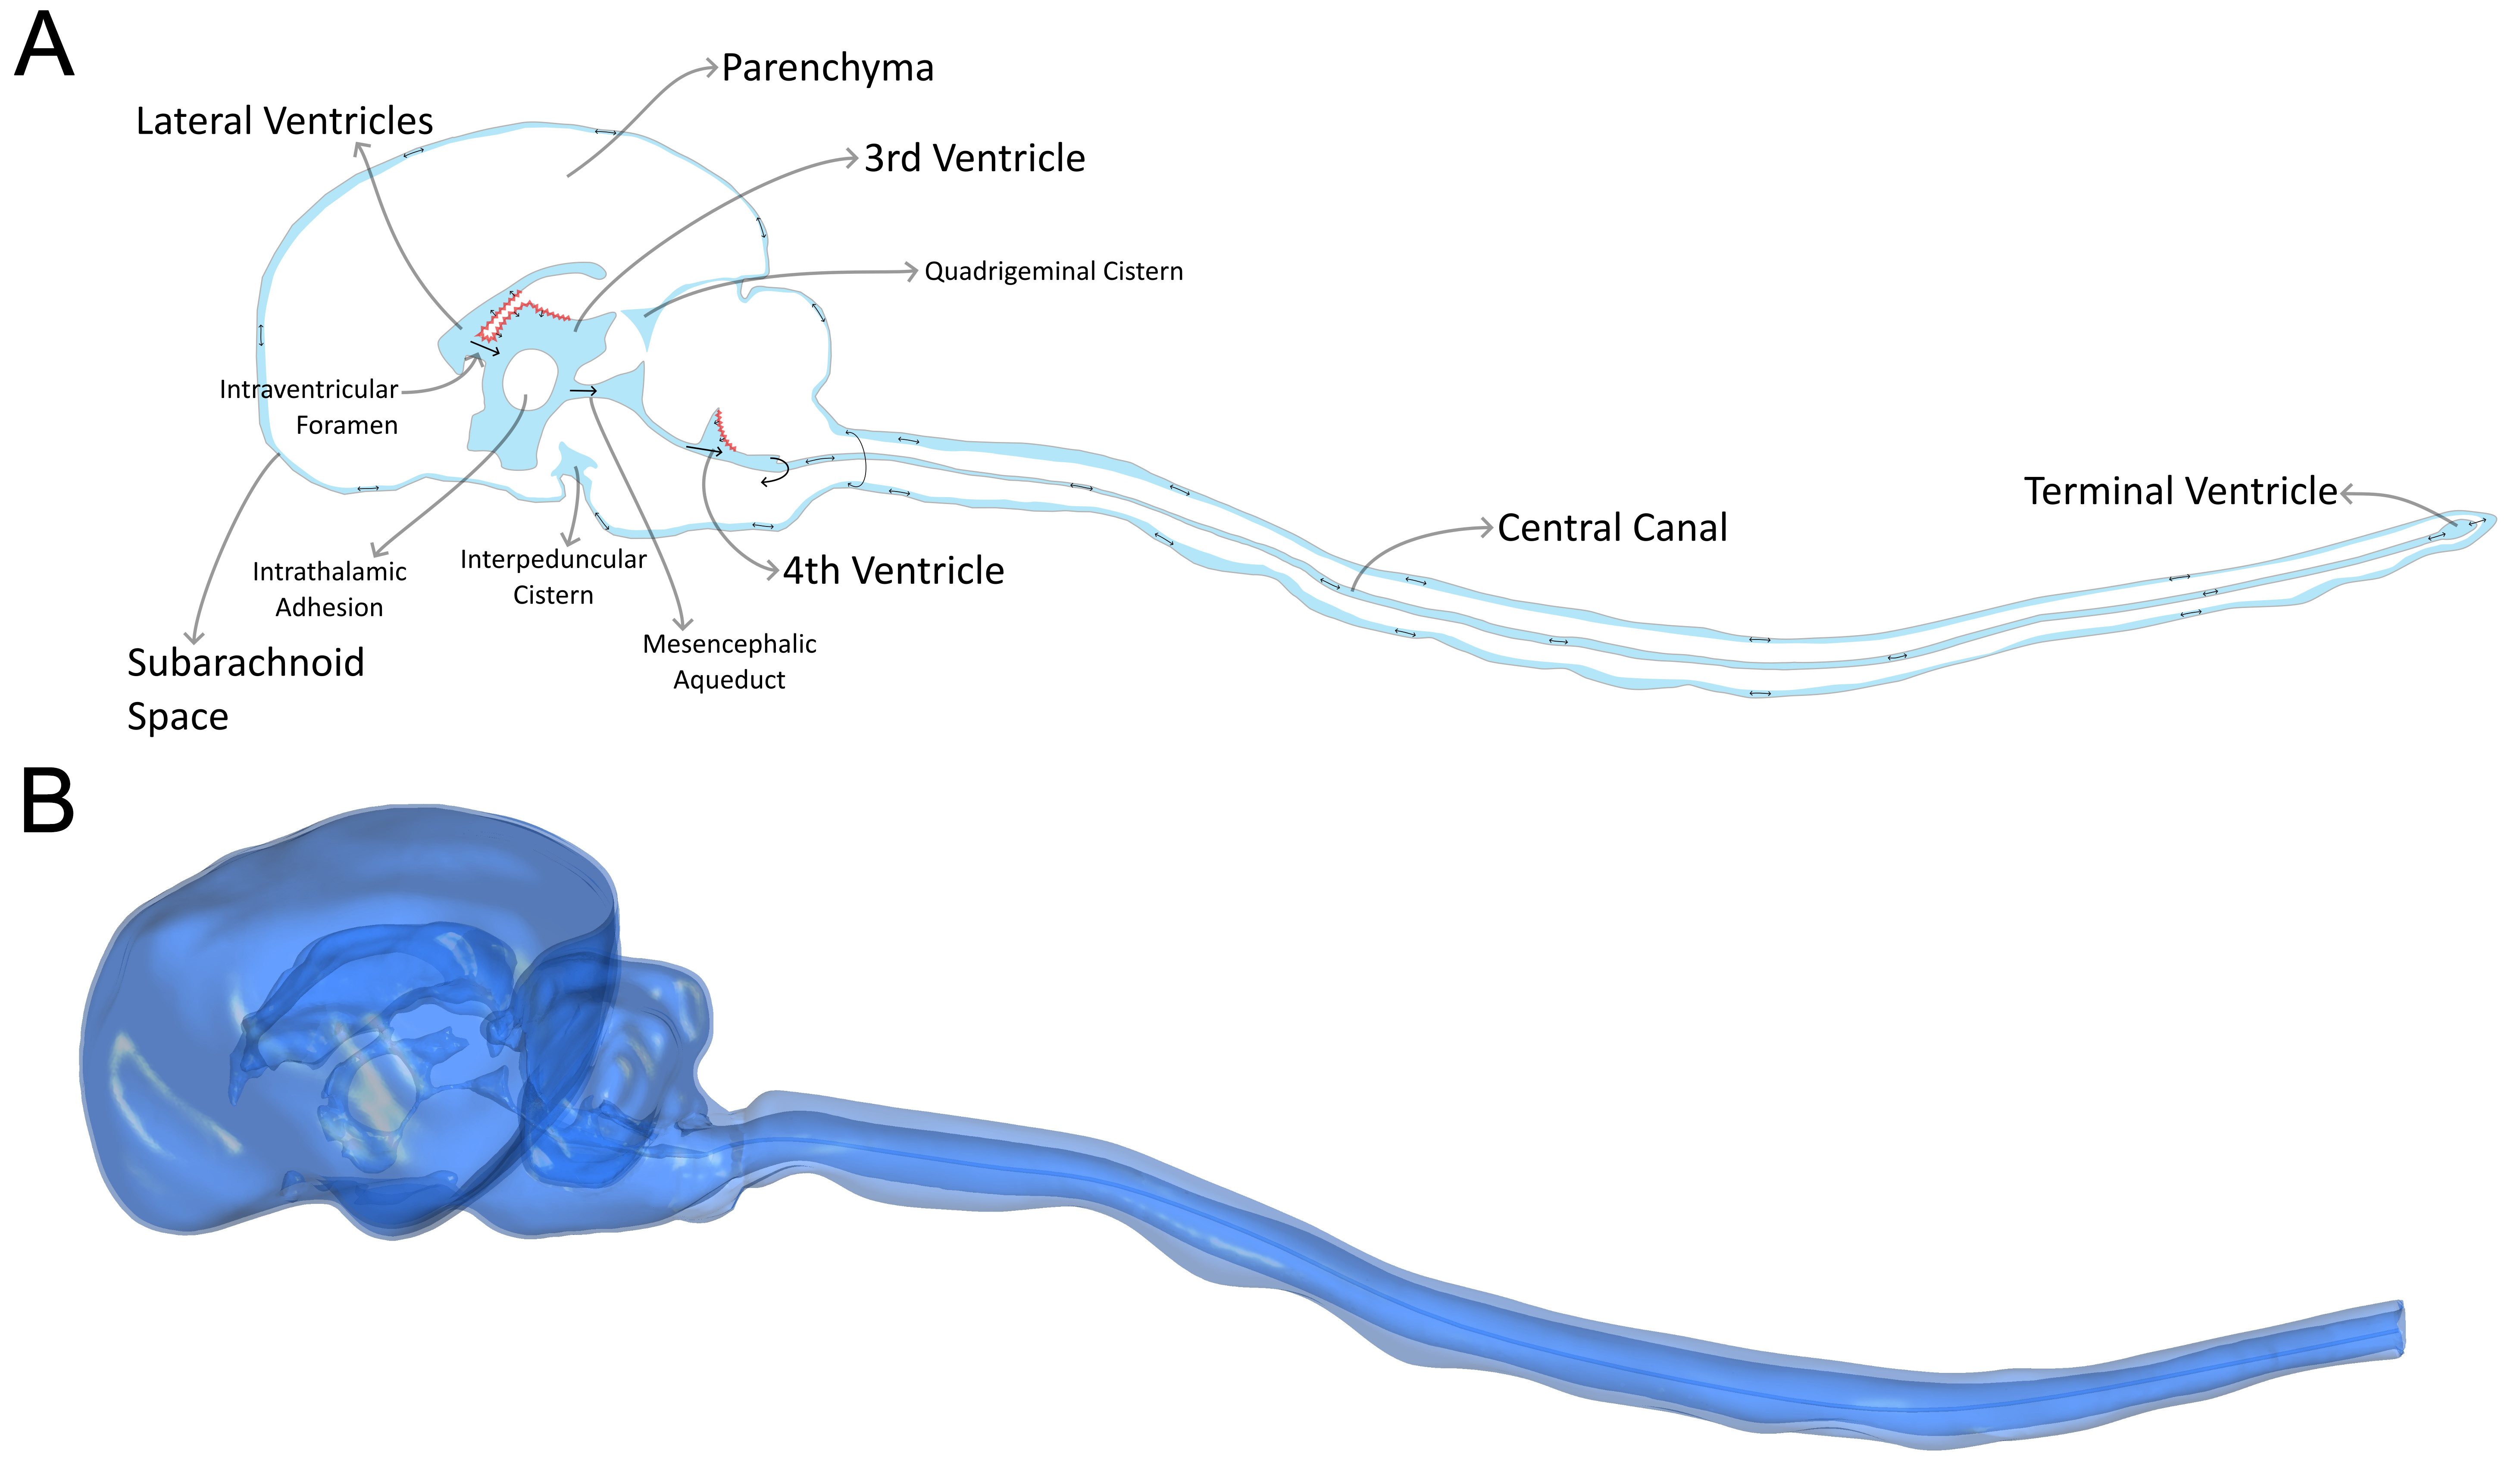
Figure 1. (A) The cerebrospinal fluid (CSF) anatomy of the brain and spinal canal in the mid-sagittal plane; red indicates the choroid plexus, black arrows indicate flow directionality; (B) An example 3D model of the CSF anatomy of the brain and spine used in this study for computational modelling.
Phase contrast-MRI (PC-MRI) has been used in some studies to characterize CSF flow dynamics in dogs; a summary of these findings is provided in Table 1. Despite their widespread use, PC-MRI CSF velocity measurements are frequently treated as direct physiological surrogates without sufficient consideration of how anatomical location, flow complexity, and measurement methodology influence the reported values. This creates a critical translational challenge: variability in CSF metrics may reflect methodological artifacts rather than true disease-related differences, limiting their reliability as clinical or research biomarkers.
Mean peak cerebrospinal fluid velocities measured at the cerebral aqueduct, foramen magnum, and cervical spinal subarachnoid space in dogs across multiple studies
| Mean subarachnoid space peak velocity [cm/s] | |||||||||
| Cho et al. (2021)[28] | Christen et al. (2021)[27] | Cerda-Gonzalez et al. (2009)[29] | Farke et al. (2024)[30] | Rich et al. (2024)[25] | |||||
| Healthy Controls | Unaffected CKCS | Brachycephalic dogs | Overall | < 10 kg | 10-20 kg | Overall | |||
| Cerebral aqueduct | 0.76 | 0.9 | 2.87 | 4.16 | 0.64 | 0.72 | 0.85 | ||
| Foramen magnum | |||||||||
| Dorsal | 0.32 | 1.2 | 0.59 | 0.4 | 0.92 | 1.63 | 1.72 | ||
| Ventral | 1.39 | 1.9 | 0.75 | 0.64 | 1.37 | 2.07 | 2.05 | ||
| Cervical spine | |||||||||
| Dorsal | 1.3 | 0.66 | 0.67 | 1.34 | 2.61 | 2.49 | |||
| Ventral | 2.2 | 0.29 | 0.62 | 1.44 | 2.47 | 2.37 | |||
While PC-MRI provides valuable insights into CSF flow dynamics, it is inherently limited to in-plane velocity measurements at a small number of locations and at a relatively low spatial and temporal resolution. Out-of-plane flow components and direct pressure measurements cannot be captured with this technique, and therefore only a partial description of CSF dynamics is obtained. Novak et al. (1974) investigated CSF pressure in dogs using radioisotope cisternography and reported the CSF pressure waveform over multiple cardiac cycles with mean pressure 117 mmH2O[15]. Physiological mechanisms influencing CSF pressure dynamics, including transient pressure propagation associated with muscular stimulation, have also been demonstrated experimentally[16], but quantitative data on the CSF dynamics in canines at rest over the cardiac cycle remain scarce.
Computational fluid dynamics (CFD) provides a complementary approach for resolving mechanistic uncertainties that limit the clinical translation of CSF flow measurements derived from in vivo imaging. CFD enables high-resolution quantification of velocity and pressure fields throughout the entire CSF space. Unlike PC-MRI, CFD allows interrogation of complex three-dimensional flow patterns, out-of-plane motion, and pressure gradients. This makes CFD particularly well suited for investigating how subtle anatomical variations influence global CSF dynamics. However, computational modelling studies of CSF dynamics in dogs are scarce and limited to semi-idealized models of the spinal column subject to hypothetical flow inputs[5,6].
While CFD modelling of CSF in humans is a well-developed field[17-21], comparable mechanistic characterization in the canine craniospinal axis is lacking, and it remains uncertain whether the key features of CSF flow identified in humans are conserved across species with distinct geometric scaling and distinct cranial morphometry. As a first step in addressing this gap, the present study provides the first CFD-based quantification of CSF hydrodynamics in the dog, simulating the entire cranio-spinal space and physiologically realistic boundary conditions consistent with arterially driven CSF flow; hypothesizing that CFD-based quantification of the CSF space can be achieved across multiple subjects using models derived from routine clinical MRI data. This study examines CKCS presenting without clinical signs of pain or other neurological dysfunction and scored Chiari-like malformation grade 0 or 1 on the Kennel Club British Veterinary Association Chiari-like malformation/syringomyelia (CMSM) health scheme[22]. By establishing a validated baseline for CSF hydrodynamics in CKCS with no evidence of CSF associated abnormalities, this work begins to address a key methodological barrier to translation: the interpretation and standardization of CSF flow metrics used to guide clinical decision-making in veterinary patients. These initial unaffected models establish a methodological framework that can be readily extended to a cohort of CKCS with varying degrees of Chiari-like malformation/syringomyelia, leveraging the abundance of clinically acquired MRI data to systematically explore how progressive anatomical deformation influences CSF flow, how surgical methods can be optimized to improve long-term outcomes, and how drug delivery strategies can be refined by enabling tracking of solute transport, optimizing delivery location, infusion rate, and delivery mechanism from clinical imaging data.
MATERIALS AND METHODS
Ethics statement
Ethical approval for this retrospective study was granted by the University of Surrey Animal Welfare and Ethical Review Body under Non-Animal Scientific Procedures Act (NASPA) Reference: NASPA-2018-005. As this study involved retrospective analysis of pre-existing clinical imaging data, no additional procedures were performed, and informed owner consent for diagnostic imaging was obtained at the time of clinical presentation.
Subject selection
From an initial MRI database of 168 CKCS, compiled by Clare Rusbridge from veterinary referral clinics, dogs were selected that had no or only minimal MRI evidence of Chiari-like malformation, resulting in a cohort of 21 cases (16 males, 5 females). These dogs were classified as CM0 or CM1 and SM0a-b under the Kennel Club/British Veterinary Association CM/SM Health Scheme[22]. All selected cases had no evidence of syringomyelia and no historical or clinical signs of pain, as assessed by Clare Rusbridge, a Diplomate of the European College of Veterinary Neurology. Dogs younger than 3 years of age were excluded, as the development of syringomyelia is age-dependent and younger dogs may not yet have expressed the phenotype. Cases with insufficient MRI coverage for model generation were also excluded; minimum imaging requirements included 1.5 T T2-weighted sagittal and transverse MRI of the full extent of the cranial SAS, and 1.5 T T2-weighted sagittal MRI of the spinal canal from the foramen magnum to the T3-T4 intervertebral disc. Finally, dogs with any CSF-associated abnormalities present on MRI (ventriculomegaly, quadrigeminal cistern expansion were excluded. The exclusion criteria left 9 dogs suitable for study (7 males, 2 females), the ages and weights of which are provided in Table 2. All MRIs used in this study were obtained from routine diagnostic investigations at a veterinary referral clinic using the protocol outlined by Rusbridge et al. (2018)[23], were used with permission to construct subject-specific geometries for computational modelling, and were originally acquired solely for diagnostic purposes rather than for research. The imaging protocol is detailed in Supplementary Section 1.
Brain volume, age, and weight for each of the 9 subjects considered suitable for computational modelling
| Brain Volume [mm3] | Age [yrs] | Weight [kg] | |
| 1 | 74,887 | 7.2 | 13.9 |
| 2 | 85,169 | 3.6 | 17.0 |
| 3 | 72,771 | 4.0 | 7.8 |
| 4 | 90,758 | 8.0 | 15.2 |
| 5 | 84,191 | 5.7 | 16.7 |
| 6 | 66,602 | 7.1 | 8.6 |
| 7 | 83,054 | 5.3 | 10.5 |
| 8 | 82,966 | 7.2 | 16.2 |
| 9 | 73,641 | 5.1 | 10.3 |
| μ | 79,338 | 5.9 | 12.9 |
| σ | 7,686 | 1.5 | 3.6 |
Geometric reconstruction
Three-dimensional representations of the ventricular system, cranial and spinal SAS, and central canal were reconstructed from T2-weighted magnetic resonance images by a single operator (author Ryan Jones). The reconstructions were based on standard anatomical landmarks and designed to represent the continuous CSF spaces relevant to craniospinal fluid motion rather than fine microanatomical detail.
The ventricular system was segmented directly from interpolated MRI data, as its dimensions were sufficiently resolved relative to image resolution. In contrast, the cranial SAS in brachycephalic dogs is often extremely narrow and falls below voxel resolution in the unprocessed MRI. To address this, the cranial SAS was represented as a thin, continuous envelope surrounding the brain parenchyma, generated by smoothing and uniformly expanding the segmented brain surface by approximately one in-plane voxel thickness. This approach preserves the presence and continuity of the cranial SAS while acknowledging the limits of MRI resolution in this region.
Larger cisternal compartments, the quadrigeminal cistern, interpeduncular cistern, and cisterna magna, were segmented directly. The spinal SAS geometry, extending from the rostral margin of C1 to the T3/4 intervertebral disc, was readily available as part of a previous study[24], and aligned with the cranial model to form a continuous craniospinal CSF domain. The spinal central canal was reconstructed from MRI, with a diameter equal to a single voxel throughout.
The resulting geometries were refined to remove imaging artifacts and ensure smooth continuity between CSF compartments. These models were intended to capture the dominant anatomical constraints on CSF flow while avoiding over-interpretation of features below the spatial resolution of MRI, an example model is shown in Figure 1B. For each of the 9 resulting models, a computational mesh was generated of sufficient resolution to capture CSF flow patterns throughout the domain.
Boundary conditions and physiological assumptions
The simulations were designed to reproduce the oscillatory component of CSF motion driven by the cardiac cycle. Cardiac-driven expansion of the cerebral vasculature during systole transiently increases intracranial volume, displacing CSF caudally toward the spinal compartment, where compliance is greater. During diastole, this process reverses and CSF moves rostrally. This mechanism was represented by a time-varying velocity condition applied uniformly over the ventricular surfaces and the inner boundary of the cranial SAS. The imposed velocity waveform was based on experimentally measured CSF flow data in dogs and was constructed to satisfy key physiological constraints: pulsatility synchronized to heart rate, dominance of caudal flow during systole, temporal asymmetry between systolic and diastolic phases, and zero net flow over one cardiac cycle[25,26]. This ensured that simulated CSF motion represented redistribution of fluid within the craniospinal system, rather than long-term accumulation or drainage.
To account for the compliance of the spinal compartment, the caudal end of the model incorporated a lumped representation of spinal dural compliance. This compliance allows temporary storage and release of CSF during the cardiac cycle and thereby modulating pressure gradients along the spine. This approach captured the functional effect of spinal compliance without explicitly modelling dural deformation. The boundary condition waveforms are provided in Figure 2.

Figure 2. Physiologically realistic velocity and pressure boundary conditions used in computational modelling of the CSF flow system over the cardiac cycle, detailed in [Supplementary Section 1]. CSF: Cerebrospinal fluid.
These assumptions isolate the oscillatory portion of CSF pressure while accurately modelling the dynamics of CSF movement.
Numerical setup
Simulations were performed using an unsteady laminar flow solver, as CSF flow in the craniospinal system is characterised by low Reynolds numbers and pulsatile laminar behaviour[21]. CSF was treated as an incompressible Newtonian fluid with the physical properties of water. The governing equations describe conservation of mass and momentum and were solved over multiple cardiac cycles to ensure stable, repeatable oscillatory behavior.
Transverse planes orthogonal to the sagittal plane were defined along the craniospinal axis at the rostral margin of C1, insertion of the apical ligament, dorsal aspect of the dens, dens-axis junction, and mid-point of each vertebral body and intervertebral discs between C2 and the T3/4 disc to collect quantitative flow data. Analysis focused on relative velocity patterns, temporal waveform features, and pressure differences arising over the cardiac cycle. For a more detailed discussion of the geometry generation, boundary conditions, numerical setup, and sensitivity studies, readers are directed to [Supplementary Materials].
RESULTS
Geometric and hydrodynamic characteristics of CSF flow in the canine craniospinal system were quantified. Flow simulations characterized pulsatile CSF dynamics, assessing regional flow rates, velocity distributions, Reynolds and Womersley numbers, and pressure gradients. An example velocity field outputted by a single model is shown in Figure 3.
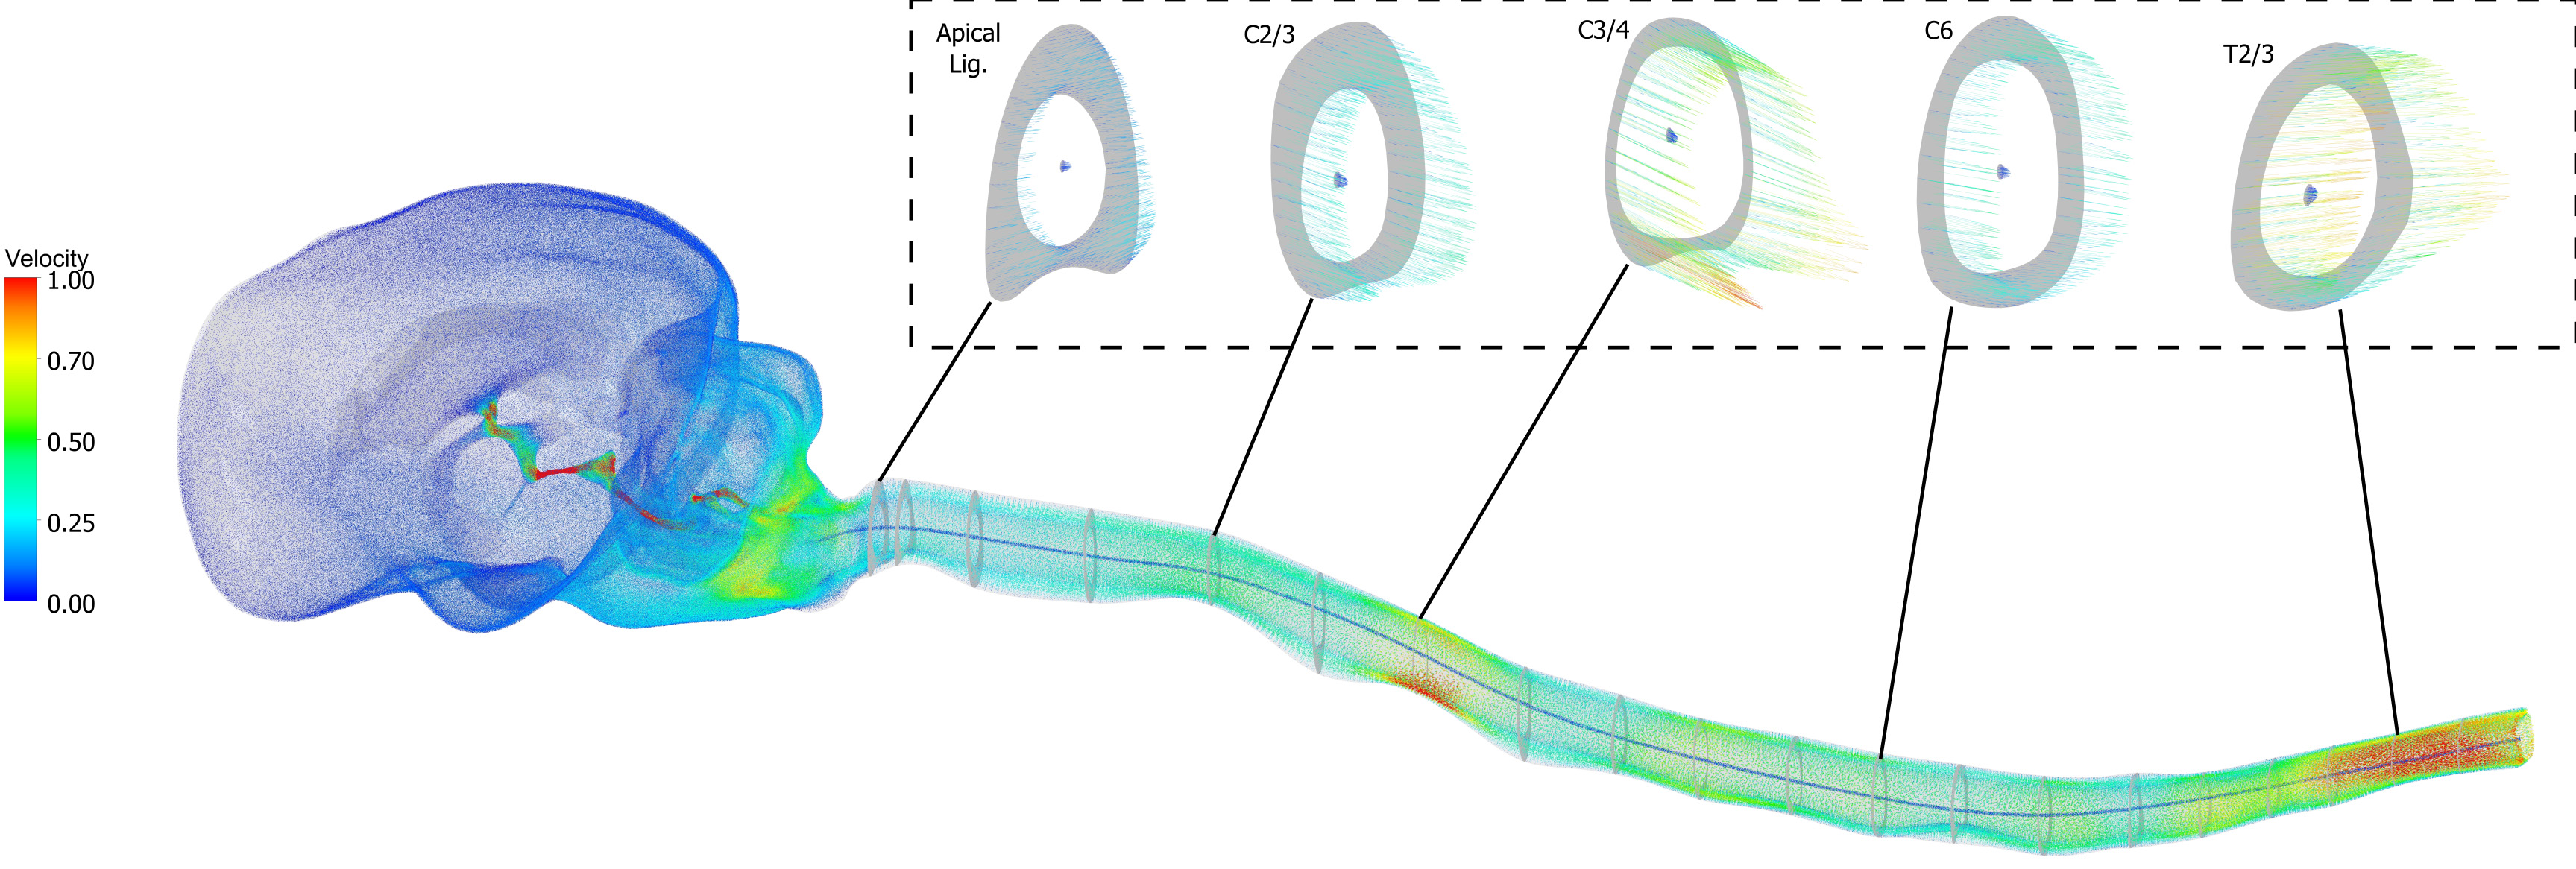
Figure 3. Instantaneous velocity field for a single model at peak systole. The velocity is presented relative to the peak velocity in the spinal SAS, and truncated at 1. SAS: Subarachnoid space.
Bulk parameters
Table 3 summarizes systolic CSF stroke volume, its regional partitioning, and associated bulk flow metrics across nine CFD models. Systolic stroke volume was 62.3 ± 7.2 µL [mean ± standard deviation (SD)], and most systolic volume displacement occurred in the SAS (> 99.9%), with less than 0.01% of flow occurring in the central canal. The ventricular pathways experienced a moderate fraction of the total CSF flow volume; The cerebral aqueduct accounted for 14.4 ± 3.4% of systolic volume, while lateral apertures accounted for 16.6 ± 3.2%.
Bulk properties outputted from each model, describing the volume fractions of CSF flow through key CSF conduits through the cardiac cycle, and critical fluid dynamics parameters
| Systolic stroke volume [μl] | Fraction of systolic volume [%] | Range [min-max] | |||||||||
| Hydraulic diameter [mm] | Reynolds number | Womersley number | |||||||||
| Central canal | Cerebral aqueduct | Lateral apertures | SAS | Central Canal | SAS | Central canal | SAS | Central canal | SAS | ||
| 1 | 58.6 | 0.05 | 11.7 | 14 | 99.95 | 0.2-0.5 | 3.9-9.3 | 0.3-0.6 | 12.0 -34.8 | 0.2-0.3 | 2.8-6.8 |
| 2 | 67.6 | 0.05 | 7 | 9.8 | 99.95 | 0.2-0.5 | 3.5-10.4 | 0.3-0.7 | 19.8-38.3 | 0.2-0.4 | 2.6-7.6 |
| 3 | 56.8 | 0.09 | 15.2 | 17.3 | 99.91 | 0.3-0.5 | 3.2-7.7 | 0.6-0.9 | 16.6-36.1 | 0.2-0.4 | 2.3-5.7 |
| 4 | 71.7 | 0.06 | 15.2 | 17.6 | 99.94 | 0.2-0.5 | 3.9-9.4 | 0.3-0.8 | 24.3-44.5 | 0.2-0.4 | 2.8-6.9 |
| 5 | 67.1 | 0.07 | 13.9 | 16.8 | 99.93 | 0.3-0.5 | 3.7-9.4 | 0.4-0.7 | 19.3-36.1 | 0.2-0.3 | 2.7-6.9 |
| 6 | 49.1 | 0.09 | 18.7 | 20.4 | 99.91 | 0.2-0.5 | 3.8-7.6 | 0.4-0.8 | 19.1-34.8 | 0.2-0.4 | 2.8-5.6 |
| 7 | 66.4 | 0.05 | 17.3 | 19.6 | 99.95 | 0.2-0.5 | 4.0-8.8 | 0.4-0.7 | 24.5-45.6 | 0.2-0.4 | 2.9-6.5 |
| 8 | 66.3 | 0.08 | 15.8 | 17.4 | 99.92 | 0.4-0.5 | 2.8-7.5 | 0.9-1.1 | 15.5-36.5 | 0.3-0.4 | 2.0-5.5 |
| 9 | 56.9 | 0.06 | 14.4 | 16.9 | 99.94 | 0.2-0.4 | 3.7-8.2 | 0.5-0.8 | 16.8-34.3 | 0.2-0.3 | 2.7-6.0 |
| μ | 62.3 | 0.07 | 14.4 | 16.6 | 99.93 | ||||||
| σ | 7.2 | 0.02 | 3.4 | 3.2 | 0.02 | ||||||
The hydraulic diameter (Dh = 4A ⁄ Pwet) of the central canal and SAS were computed from the nodal coordinates of each contour along the spine, where A was the cross-sectional area and Pwet was the wetted perimeter. These were found to range from 0.2 mm to 0.5 mm in the central canal and 2.8 to 10.4 mm in the SAS.
Reynolds number (
CSF velocity
Figure 4 shows the relative CSF a. max and b. mean velocity along the craniospinal axis normalized to the max/mean velocity and C2; a region commonly reported in CSF in vivo studies. Mean max velocities followed the same trend, with max relative velocities exhibiting greater amplitude. Relative velocities were lowest in the foramen magnum, before increasing to around 1 in the cervical SAS. A further increase in velocity was observed at the cervico-thoracic junction and continuing into the thoracic spine. In the central canal, as the anatomy was idealized to a pipe of approximately constant diameter, the variance in velocity was minimal down the spinal canal. Peak CSF velocity across the models was approximately 0.4 cm/s in this region.
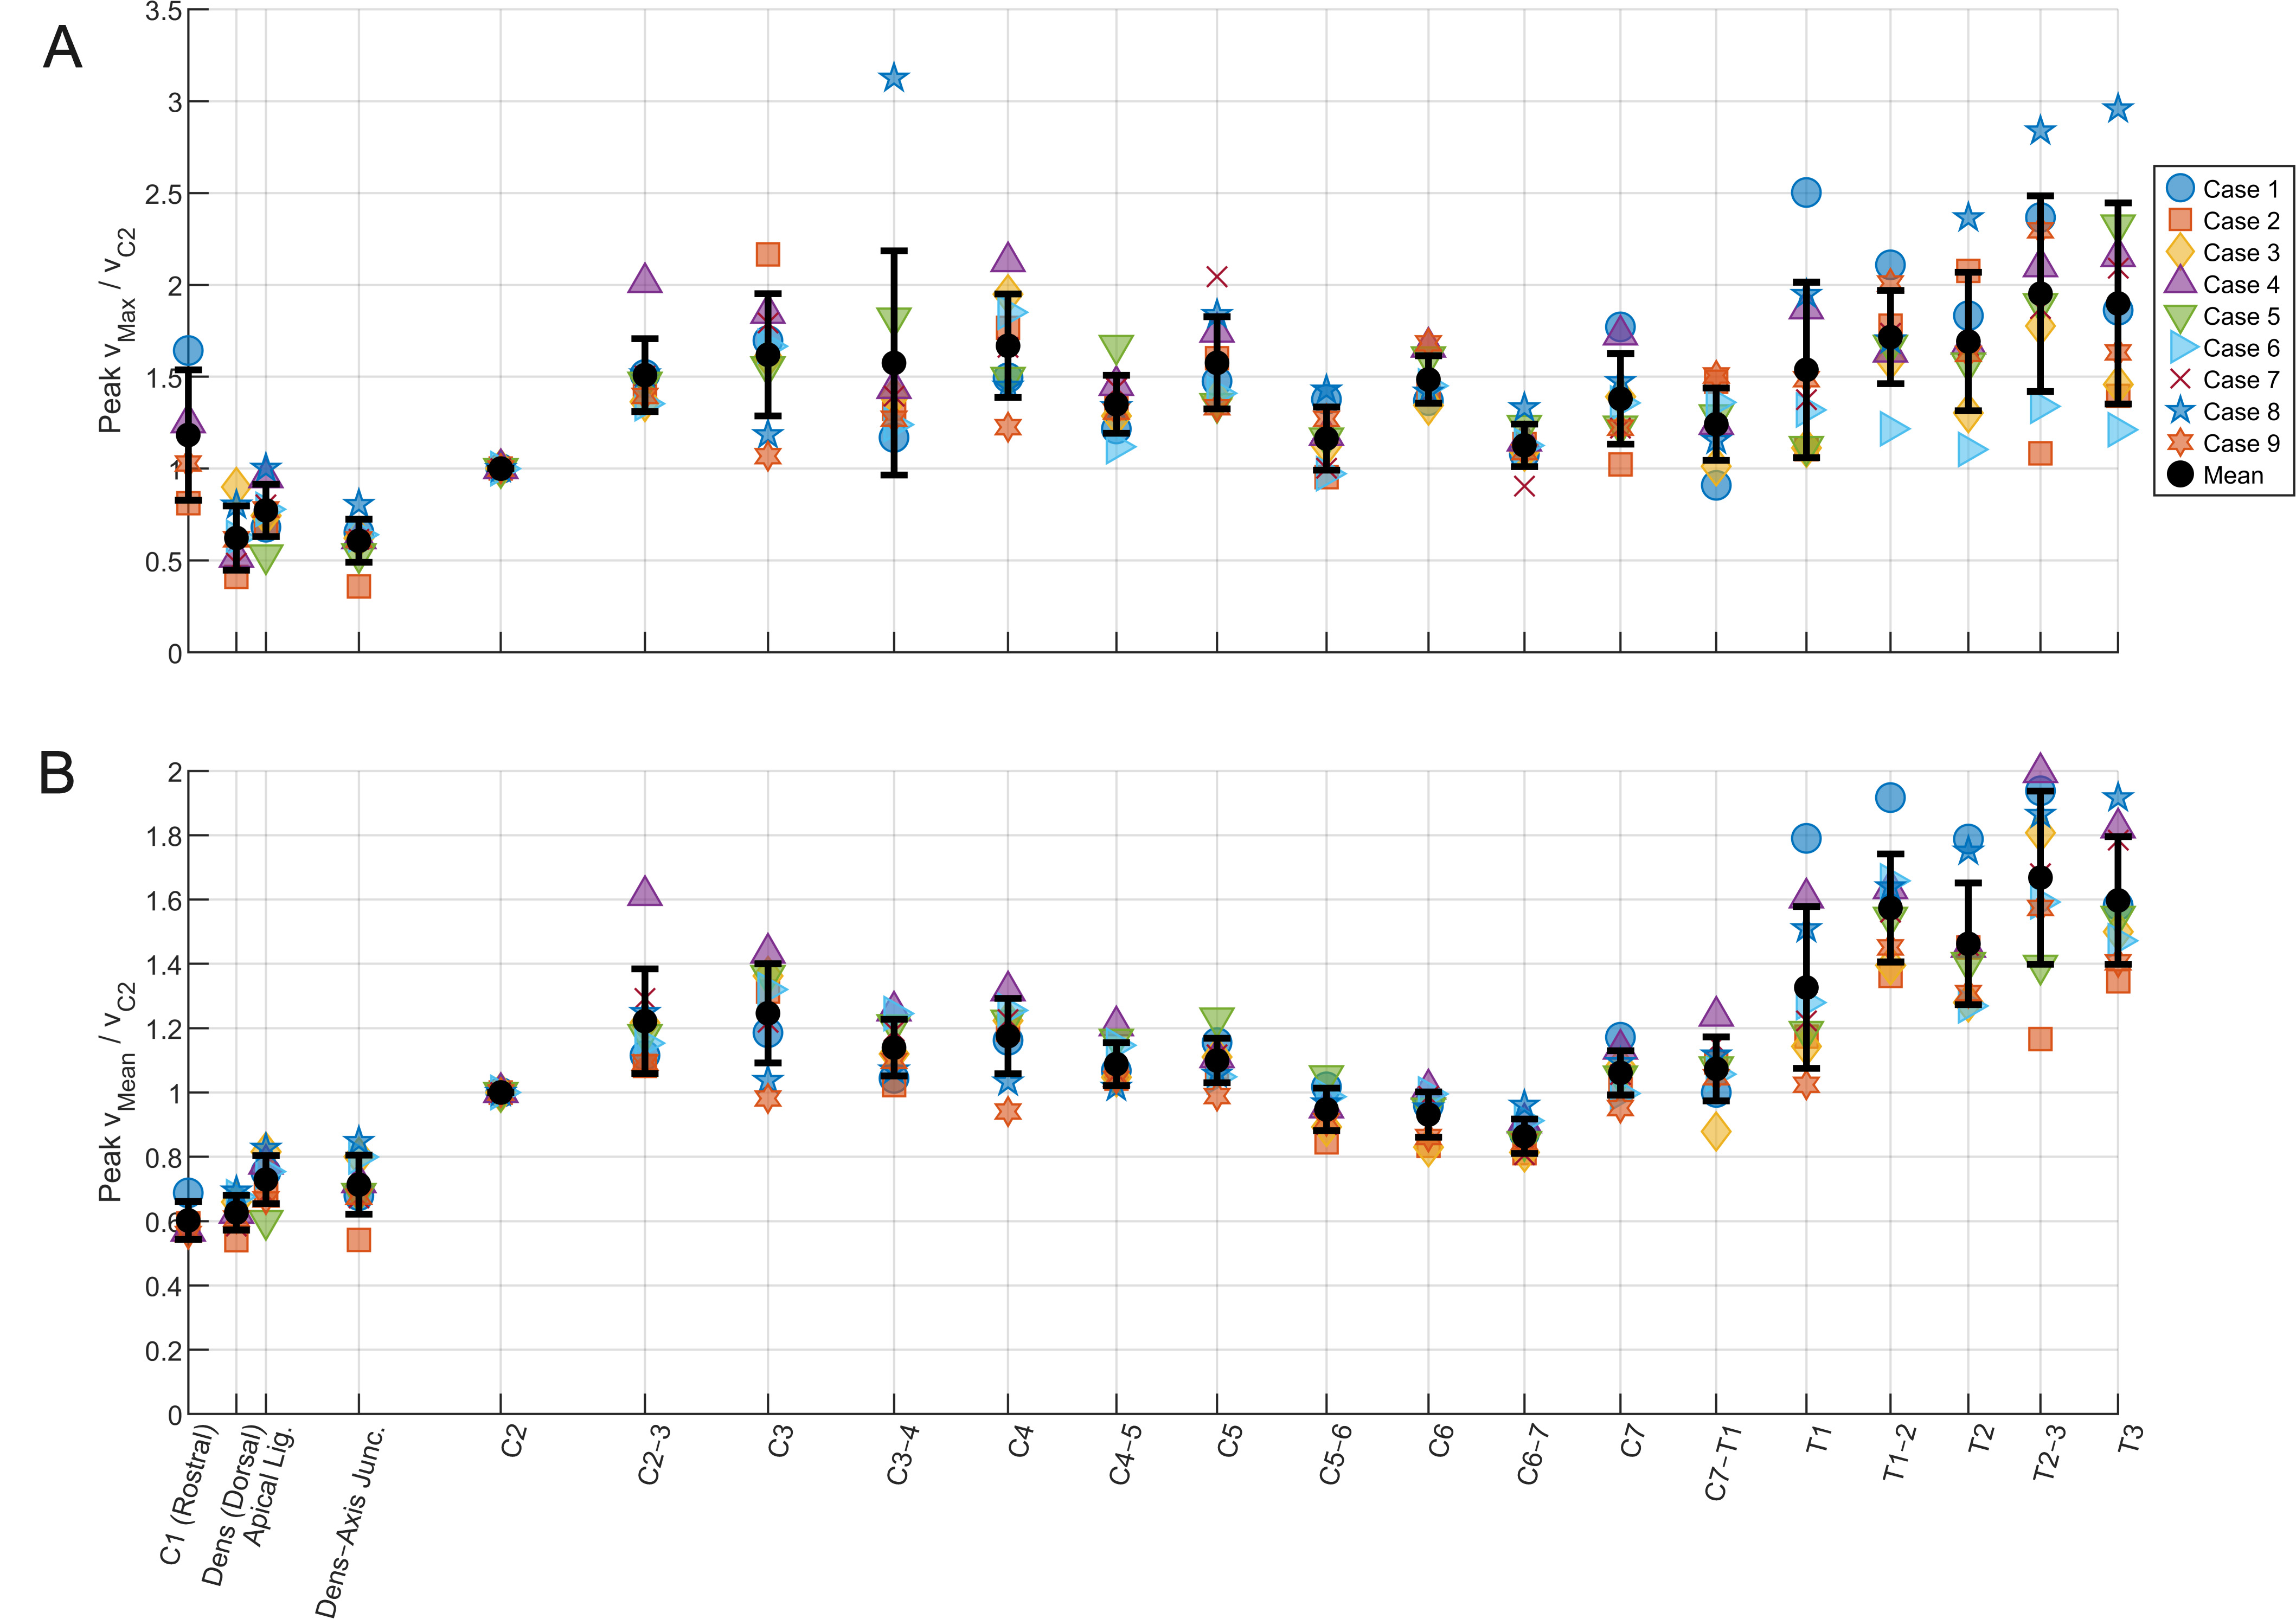
Figure 4. (A) max and (B) mean velocity down the craniospinal axis for each CFD simulation, relative to the velocity at C2. Mean is presented with error bars of 1 standard deviation. CFD: Computational fluid dynamics.
Figure 5A illustrates the distribution of CSF velocity within the cerebral aqueduct, relative to the maximum velocity measured at a transverse aqueduct slice. Velocity contours revealed evidence of flow separation,
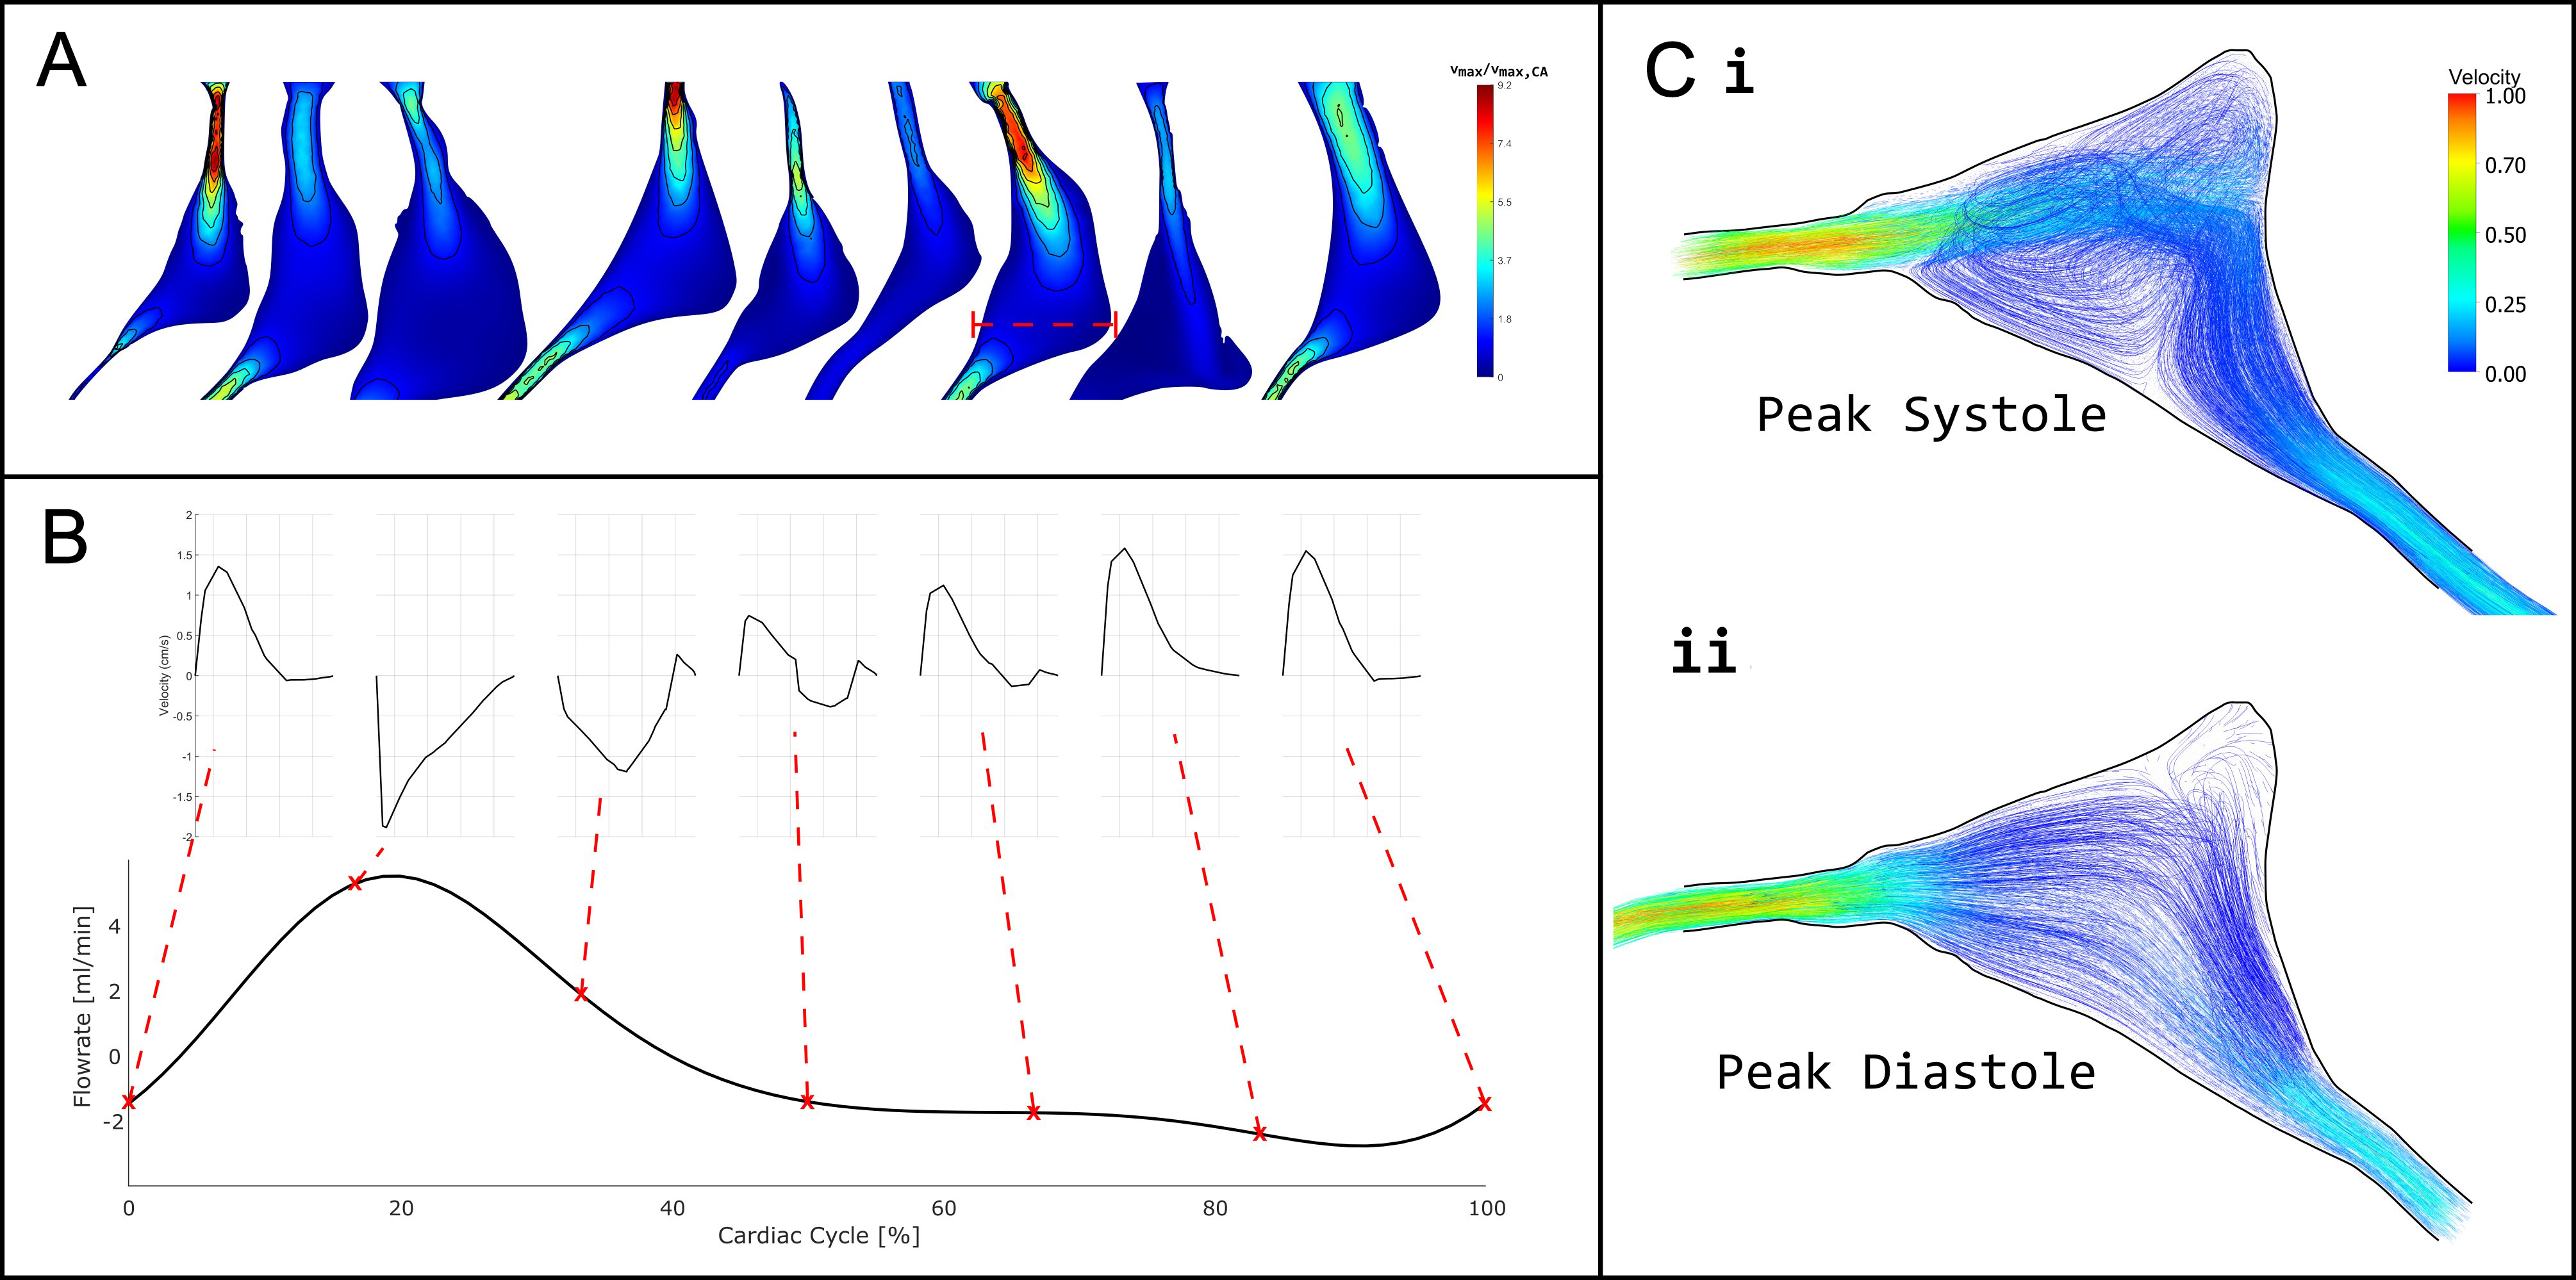
Figure 5. (A) Normalised CSF velocity magnitude within the cerebral aqueduct at peak systole (20% of the cardiac cycle), shown relative to the maximum velocity measured at a transverse slice through the mid-ampulla; (B) Flow rate through the transverse slice at the mid-ampulla of a single model shown as a red dashed line in (A), with the velocity profiles through the middle of the cross section shown at various points in the cardiac cycle; (C) Vector plot and streamlines of velocity magnitude in the mid-ampulla of the cerebral aqueduct at i. peak systole and ii. peak diastole relative to peak velocity in systole. CSF: Cerebrospinal fluid.
CSF pressure
The rostral-caudal pressure gradient was approximately constant; across the nine subjects, the mean pressure gradient in the SAS and central canal were 0.2 Pa/mm and 0.3 Pa/mm, respectively. A transmural pressure difference across the spinal cord between the SAS and central canal was observed, increasing rostrally and approximately 30 Pa in some models.
DISCUSSION
It is necessary to compare the results of a computational simulation to known quantities reported in the literature to assess the physiological plausibility of the results. To date, no studies have directly measured CSF pressure waves in dogs; hence, this study is limited to CSF flow velocities reported across a range of breeds. Such studies generally report velocities from broader anatomical regions (e.g. “foramen magnum” or “cisterna magna”) and across mixed breeds and body sizes. Where possible, data from the literature were categorized based on the anatomical descriptions and figures provided, to allow comparison at corresponding locations in the models.
Christen et al. (2021) and Cho et al. (2021) investigated CSF flow within the cerebral aqueduct and cervical spinal SAS in cohorts of six Beagles[27,28]. Both studies reported pulsatile, bidirectional CSF flow with marked waveform asymmetry, characterised by narrow, high-amplitude systolic peaks and broader, lower-amplitude diastolic troughs. A ventral-dominant flow distribution was also observed, with reduced dorsal motion, likely attributable to SAS geometry and posture during imaging. Cerda-Gonzalez et al. (2009) examined CSF flow in the spinal SAS of fifty-nine CKCS and reported more complex flow patterns[29]. Localised regions of high velocity were identified and were strongly correlated with syrinx presence and size, although not with neurological clinical sign severity. Dorsal CSF velocities were significantly reduced in CKCS; however, the degree of ventral flow dominance was lower than that reported in Beagles[27,28], likely reflecting morphological differences between brachycephalic CKCS and mesocephalic Beagles. Rich et al. (2024) investigated physiological variability in a population of 32 neurologically normal dogs of mixed breeds, of which four were classified as brachycephalic; finding that body weight, age, and sex significantly influence peak CSF velocities[25].
It should be noted that the aqueduct velocities reported by Farke et al. (2024) were considerably higher than those in the aforementioned studies[30]. This discrepancy is likely due to the more rostral sampling location selected at the junction between the cerebral aqueduct and the third ventricle. At this level, the aqueduct narrows substantially, and, due to conservation of volumetric flow, measured velocities increase accordingly.
Z-scores were calculated using the reported literature means [Table 1] and standard deviations, providing a measure of deviation relative to the observed inter-subject variability in each study. Given the anatomical and methodological variability inherent in PC-MRI CSF velocity measurements, z-scores within approximately ±2 were considered to indicate reasonable agreement. These data are presented in Table 4.
Comparison of peak subarachnoid space cerebrospinal fluid velocities reported in canine studies and the present computational fluid dynamics (CFD) simulations
| Subarachnoid space peak velocity [cm/s] | |||||||||||||||||
| Insertion site of the apical ligament | Dens-axis junction | C2 | C2/3 | ||||||||||||||
| μ | σ | n | z | μ | σ | n | z | μ | σ | n | z | μ | σ | n | z | ||
| Rich et al. (2024)[25] | |||||||||||||||||
| Mixed (< 10 kg) | 1.37 | 0.36 | 5 | -1.2 | 1.44 | 0.39 | 4 | -0.5 | |||||||||
| Mixed (10-20 kg) | 2.07 | 1.37 | 8 | -0.8 | 2.61 | 1.46 | 6 | -0.9 | |||||||||
| Mixed (all) | 2.05 | 1.06 | 29 | -1.0 | 2.49 | 1.13 | 20 | -1.1 | |||||||||
| Cerda-Gonzalez et al. (2009)[29] | |||||||||||||||||
| Controls | 0.75 | 0.24 | 5 | -0.03 | 0.66 | N/A | 2 | ||||||||||
| Unaffected CKCS | 0.64 | 0.22 | 49 | 0.5 | 0.67 | 0.24 | 44 | 5 | |||||||||
| Cho et al. (2021)[28] | |||||||||||||||||
| Beagles | 1.39 | 0.13 | 6 | -3.4 | |||||||||||||
| Christen et al. (2021)[27] | |||||||||||||||||
| Beagles | 1.9 | 0.8 | 6 | -1.2 | 2.2 | 0.8 | 6 | -1.8 | |||||||||
| Experimental CFD | |||||||||||||||||
| CKCS | 0.95 | 0.12 | 9 | 0.74 | 0.13 | 9 | 1.23 | 0.13 | 9 | 1.86 | 0.32 | 9 | |||||
Using the weight-stratified datasets reported by Rich et al. (2024), CFD velocities at the insertion site of the apical ligament yielded z-scores of -1.2 for dogs < 10kg, -0.8 for dogs between 10 kg and 20 kg, and -1.0 for the overall dataset[25]. At C2, corresponding z-scores were -0.5, -0.9, and -1.1, respectively. These values indicate that the CFD-derived velocities lie well within 1 to 1.5 standard deviations of the reported experimental means, suggesting good agreement given the differences in breed and methodology.
Comparisons with data from beagles revealed larger deviations at the insertion site of the apical ligament, with z-scores of -3.4 relative to Cho et al. (2021) and -1.3 relative to Christen et al. (2021)[27,28]. The moderately large deviation from the data presented by Cho et al. (2021) reflects a combination of breed-specific anatomical differences, small sample size, and the small relative size of their standard deviation[28]. In contrast, the comparison with Christen et al. (2021) yields a z-score in closer agreement. At the dens-axis junction, comparison with Christen et al. (2021) resulted in a z-score of -1.8, again consistent with moderate deviation within the expected physiological spread[27].
Using data presented by Cerda-Gonzalez et al. (2009), CFD-derived peak velocities produced z-scores of -0.03 relative to controls and 0.5 relative to unaffected CKCS at the dens-axis junction, indicating very good agreement with both cohorts. At the C2/3 level, however, comparison with unaffected CKCS resulted in a z-score of 6.9. This large deviation appears to be driven primarily by the small reported standard deviation in Cerda-Gonzalez et al. (2009) combined with systematically lower peak velocities than those reported in most other studies. While breed-specific differences may contribute, this is unlikely to fully explain the discrepancy, as the present simulations were also based on CKCS anatomy. Methodological factors may therefore play a role; Cerda-Gonzalez et al. (2009) employed earlier phase-contrast MRI techniques with lower spatial and temporal resolution than more recent studies, which may alias peak velocity estimation[29].
These data demonstrate that substantial variability exists in reported CSF velocities within the literature, particularly for measurements broadly attributed to the foramen magnum or cisterna magna. Importantly, large z-scores do not necessarily indicate poor agreement but rather reflect the sensitivity of peak velocity measurements to precise anatomical location, sampling strategy, and cohort characteristics. The alignment with literature values supports the physiological plausibility of the simulated flow fields and provides confidence in using the model to explore spatial flow patterns along the spinal canal.
The results indicate that within the cisterna magna alone, peak systolic velocity varies markedly between closely spaced anatomical landmarks. Consequently, studies that report CSF velocity measurements from the cisterna magna or foramen magnum without precise anatomical specification may inadvertently conflate distinct flow regimes. These findings highlight the importance of rigorous anatomical definition when acquiring and interpreting CSF velocity data, particularly when comparing results across studies or using such measurements for model validation.
Another commonly reported location for CSF velocity measurement in veterinary studies is the cerebral aqueduct; most frequently sampled at the mid-ampulla[25,27,28], or at the rostral end of the aqueduct connecting to the third ventricle[30]. These locations are often selected due to their clear anatomical definition.
In the present models, the cerebral aqueduct exhibited markedly complex flow behavior. As shown in Figure 5, peak systolic flow was characterized by flow separation, jet-like structures, and pronounced secondary flow patterns, particularly within the distended mid-ampullary region. Velocity profiles demonstrated substantial spatial heterogeneity, with localized high-velocity jets adjacent to regions of recirculation indicating that the cerebral aqueduct does not support a simple, fully developed flow regime.
These complex flow patterns are likely generated by abrupt changes in cross-sectional area along the aqueduct, especially the transition between the relatively constricted rostral segment and the expanded mid-ampulla. In brachycephalic breeds, and particularly in dogs with neuroparenchymal overcrowding, constriction of the rostral aqueduct may be exacerbated, increasing the likelihood of jet formation, flow separation, and secondary flow patterns. Under these conditions, local peak velocities become highly sensitive to both anatomy and sampling location.
These findings suggest that the cerebral aqueduct represents an inherently unreliable site for quantitative CSF velocity sampling. While anatomically convenient, the highly complex and spatially variable flow field makes reported velocities strongly dependent on precise measurement location and temporal resolution. Measurement techniques sampling below the time-/length-scales upon which complex flow patterns occur are therefore particularly vulnerable to spatial and temporal aliasing in this region. As a result, cerebral aqueduct velocity measurements should be interpreted with caution, especially when used for cross-study or cross-cohort comparisons.
Table 3 shows the regional partitioning of CSF flow, with a significantly higher portion of CSF volume exchange occurring in the SAS, consistent with its larger cross-sectional area and lower hydrodynamic resistance. This implies that, in the first approximation, central canal is negligible and can therefore be neglected. However, syrinx presentation in dogs is predominantly communicating, with a patent central canal. Therefore, from a syringomyelia research perspective, flow in the central canal is physiologically significant and therefore should be represented in canine CSF models.
The Womersley numbers in the SAS and central canal indicate that CSF flow exhibits a range of pulsatile behavior along the spinal axis. In the SAS, α ranged from 2.0 to 7.6, suggesting that inertial effects become more pronounced likely reflect cross-sectional tapering leading to stronger transient inertia effects. In contrast, the lower Womersley numbers in the central canal (< 0.5) indicate that viscous effects dominate, and velocity profiles are broadly parabolic throughout the cardiac cycle.
Velocity profiles in the SAS displayed some characteristic behavior for pulsatile inertia-dominated flow, with a central “plug” that lagged behind near-wall velocities, whereas flow in the central canal was more uniform and dominated by viscous diffusion. This distinction has implications for solute transport and mixing, as areas with higher α may experience greater phase lag between pressure and velocity, enhancing shear-driven dispersion. These findings were consistent with the low Reynolds numbers observed throughout the domain (< 50), confirming that CSF motion remained laminar and strongly influenced by viscous forces. Together, the Womersley and Reynolds number distributions suggest that while unsteady inertial effects shape the pulsatile response of the SAS; the overall regime in both compartments remained viscous-dominated. Compared with previous studies in humans and monkeys, the Womersley numbers observed in the dog are lower, further indicating a greater relative influence of viscosity in CKCS CSF flow[21,31-36]. It is worth noting that CSF in the CKCS, a brachycephalic breed, will exhibit different flow patterns to a breed with a comparatively larger SAS.
Figure 4 demonstrates that peak CSF velocities reached values up to approximately three times those measured at C2, exceeding the magnitudes reported in previous canine MRI studies. However, existing experimental studies typically report CSF velocities caudally to the C2/3 intervertebral disc, and CSF flow characteristics beyond this level have not been described. The elevated velocities observed in the present models therefore do not represent disagreement with the published literature but rather reflect an extension of CSF flow characterisation into more caudal regions of the canine spine that have not previously been quantified experimentally.
Figure 4 also reveals spatial trends in SAS velocity along the craniospinal axis. Rostral to C2, CSF velocities are relatively low, increasing towards the cervical spine and remaining broadly consistent between C2 and C7. A further increase in velocity is observed at the transition from the cervical to the thoracic spine.
When maximum velocity was extracted independently at each transverse plane, a consistent alternating pattern was observed along the cervical spine, with lower peak velocities at intervertebral disc levels and higher peaks at the midpoints of vertebral bodies. Because the flow is pulsatile and peak values correspond to nodal maxima, the observed variation is plausibly explained by spatial variations in local hydraulic impedance within the SAS cross-section, which introduce phase differences in the timing and location of peak velocity. This effect is substantially attenuated in the mean velocity profiles, supporting the interpretation that the observed modulation in peak velocity arises from localised, in-plane impedance variations.
In the present models, a transmural pressure gradient was observed between the central canal and SAS across the spinal cord. This was investigated further using a single model representing the spine from the foramen magnum to the level of the second lumbar vertebra. This indicated that, while these results indicate that such a gradient can arise under physiologically realistic pulsatile forcing, the nature of this gradient was found to be highly sensitive to the hydraulic impedance of spinal segments not represented in the truncated domain. Both the presence and character of the pressure gradient depend strongly on the downstream impedance. Consistent with this sensitivity, the central canal and SAS exhibited distinct temporal pressure and flow responses to the same pulsatile boundary conditions. The central canal’s high viscous resistance produced a rapid response to pressure reversal, followed by a delayed secondary adjustment as fluid volume was redistributed between the two pathways. Future investigations should specifically target this behavior using models explicitly designed to resolve full-length spinal impedance and inter-compartmental coupling, as transmural pressure gradients may play a critical role in the pathogenesis of syringomyelia.
Limitations
This study employed rigid-wall CFD models of CSF flow in CKCS, without incorporating fluid-structure interaction; dynamic deformation of the spinal dura, ventricular walls, and brain tissue was not captured. Fine anatomical features (nerve roots, trabeculae, and small cisternal substructures) were omitted, which may lead to overestimation of local secondary flows and underestimation of flow resistance at microanatomical scales. The model geometry was reconstructed from MRI data with relatively low spatial resolution, particularly in the cranial SAS, which necessitated the assumption of a constant SAS thickness and likely smoothed out local geometric variations. Boundary conditions were idealised rather than derived from subject-specific MRI flow measurements, with a uniform pulsatile inlet waveform applied across the ventricular system and cranial SAS, potentially limiting the model’s ability to reproduce subtle spatial flow heterogeneity. Compliance was represented as a single lumped parameter at the caudal outlet, rather than a spatially distributed or frequency-dependent property, which may influence the phase and amplitude of pressure-flow dynamics along the spinal axis. Finally, the study was based on neurologically normal CKCS, limiting generalizability to other breeds, disease states, or individuals with varying degrees of Chiari-like malformation or syringomyelia.
Conclusion
This study provides the first subject-specific computational characterisation of craniospinal CSF dynamics in clinically normal Cavalier King Charles Spaniels. The results demonstrate that CSF flow in the canine craniospinal system is strongly shaped by regional anatomy and compartmental impedance, producing marked spatial heterogeneity in velocity and pressure despite globally laminar flow. In particular, complex flow structures within the cerebral aqueduct and location-dependent velocity modulation along the spine indicate that commonly reported in vivo CSF metrics are highly sensitive to sampling site and local geometry. These findings establish a physiologically grounded baseline for canine CSF hydrodynamics and provide a mechanistic framework for interpreting CSF flow measurements in both veterinary patients and translational models of Chiari-like malformation and syringomyelia. These data further facilitate the simulation of surgical interventions, providing a baseline against which post-operative outcomes can be quantitatively assessed, and may function to inform and optimize intrathecal drug delivery.
DECLARATIONS
Authors’ contributions
Supervised the study, provided substantive revisions to the manuscript: Cirovic S, Rusbridge C
Jointly designed the study: Jones R, Rusbridge C, Cirovic S
performed the model segmentation, computational modelling, analysis, and interpretation, Drafted the initial version of the manuscript: Jones R
Contributed significantly to data interpretation: Cirovic S
All authors reviewed, edited, and approved the final version of the manuscript.
Availability of data and materials
All original data supporting the findings of this study are available from the corresponding author upon reasonable request.
AI and AI-assisted tools statement
Not applicable.
Financial support and sponsorship
None.
Conflicts of interest
All authors declared that there are no conflicts of interest.
Ethical approval and consent to participate
Ethical approval for this study was granted by the University of Surrey Animal Welfare and Ethical Review Body under NASPA reference: NASPA-2018-005. As this study involved retrospective analysis of pre-existing clinical imaging data, no additional procedures were performed, and informed owner consent for diagnostic imaging was obtained at the time of clinical presentation.
Consent for publication
Not applicable.
Copyright
© The Author(s) 2026.
Supplementary Materials
REFERENCES
1. Sadler B, Kuensting T, Strahle J, et al. Prevalence and impact of underlying diagnosis and comorbidities on chiari 1 malformation. Pediatr Neurol. 2020;106:32-7.
2. Ciaramitaro P, Massimi L, Bertuccio A, et al. Diagnosis and treatment of Chiari malformation and syringomyelia in adults: international consensus document. Neurol Sci. 2022;43:1327-42.
3. Klimov VS, Gulay YS, Evsyukov AV, Moysak GI. Syringosubarachnoid shunting in treatment of syringomyelia: a literature review and a clinical case report. Zh Vopr Neirokhir Im N N Burdenko. 2017;81:58-65.
4. Jones R, Cirovic S, Rusbridge C. A review of cerebrospinal fluid circulation with respect to Chiari-like malformation and syringomyelia in brachycephalic dogs. Fluids Barriers CNS. 2025;22:25.
5. Cirovic S, Lloyd R, Jovanovik J, Volk HA, Rusbridge C. Computer simulation of syringomyelia in dogs. BMC Vet Res. 2018;14:82.
6. Cirovic S, Rusbridge C. Slosh simulation in a computer model of canine syringomyelia. Life. 2021;11:1083.
8. Dandy WE. An experimental, clinical and pathological study: part 1. -experimental studies. Am J Dis Child. 1914;VIII:406-82.
10. Becker DP, Nulsen FE. Control of hydrocephalus by valve-regulated venous shunt: avoidance of complications in prolonged shunt maintenance. J Neurosurg. 1968;28:215-26.
11. Gage ED, Hoerlein BF. Suegical treatment of canine hydrocephalus by verticuloatrial shunting. J Am Vet Med Assoc. 1968;153:1418-31.
12. Williams B, Weller RO. Syringomyelia produced by intramedullary fluid injection in dogs. J Neurol Neurosurg Psychiatry. 1973;36:467-77.
13. The British Syringomyelia Chiari Group. Available from: https://www.annconroytrust.org/wp-content/uploads/2022/04/British-Syringomyelia-Chiari-Group-Constitution.docx [Last accessed on 1 Jul 2026].
14. Alperin N. Does the brain have mechanical compliance? Magn Reson Mater Phys Biol Med. 2020;33:753-6.
15. Novak G, Digel C, Burns B, James AE. Cerebrospinal fluid pressure measurements and radioisotope cisternography in dogs. Lab Anim. 1974;8:85-91.
16. Yuan XY, Yang KQ, Ma Y, et al. Temporal and spatial variations in CSF pressure are influenced by electrical stimulation of the OCI muscles in beagles. Sci Rep. 2025;15:33560.
17. Kurtcuoglu V, Poulikakos D, Ventikos Y. Computational modeling of the mechanical behavior of the cerebrospinal fluid system. J Biomech Eng. 2005;127:264-9.
18. Vandenbulcke S, Condron P, Dolfen H, et al. Evaluating amplified magnetic resonance imaging as an input for computational fluid dynamics models of the cerebrospinal fluid. Interface Focus. 2025;15:20240039.
19. Lloyd RA, Fletcher DF, Clarke EC, Bilston LE. Chiari malformation may increase perivascular cerebrospinal fluid flow into the spinal cord: A SUBJEct-specific computational modelling study. J Biomech. 2017;65:185-93.
20. Martin BA, Kalata W, Shaffer N, Fischer P, Luciano M, Loth F. Hydrodynamic and longitudinal impedance analysis of cerebrospinal fluid dynamics at the craniovertebral junction in type I Chiari malformation. PLoS One. 2013;8:e75335.
21. Loth F, Yardimci MA, Alperin N. Hydrodynamic modeling of cerebrospinal fluid motion within the spinal cavity. J Biomech Eng. 2001;123:71-9.
22. British Veterinary Association. Chiari Malformation/Syringomyelia Scheme (CM/SM Scheme). 2013. Available from: https://www.bva.co.uk/canine-health-schemes/cmsm-scheme/ [Last accessed on 1 Jul 2026].
23. Rusbridge C, Stringer F, Knowler SP. Clinical application of diagnostic imaging of chiari-like malformation and syringomyelia. Front Vet Sci. 2018;5:280.
24. Jones R, Cirovic S, Rusbridge C. MRI-derived three-dimensional modelling reveals cervicothoracic subarachnoid space narrowing in syringomyelia-affected cavalier king charles spaniels. BMC Vet Res. 2026;22:306.
25. Rich J, Hubler S, Vidondo B, Raillard M, Schweizer D. Influence of body weight, age, and sex on cerebrospinal fluid peak flow velocity in dogs without neurological disorders. J Vet Intern Med. 2024;38:1608-17.
26. Causemann M, Vinje V, Rognes ME. Human intracranial pulsatility during the cardiac cycle: a computational modelling framework. Fluids Barriers CNS. 2022;19:84.
27. Christen MA, Schweizer-Gorgas D, Richter H, Joerger FB, Dennler M. Quantification of cerebrospinal fluid flow in dogs by cardiac-gated phase-contrast magnetic resonance imaging. J Vet Intern Med. 2021;35:333-40.
28. Cho H, Kim Y, Hong S, Choi H. Cerebrospinal fluid flow in normal beagle dogs analyzed using magnetic resonance imaging. J Vet Sci. 2021;22:e2.
29. Cerda-Gonzalez S, Olby NJ, Broadstone R, McCullough S, Osborne JA. Characteristics of cerebrospinal fluid flow in Cavalier King Charles Spaniels analyzed using phase velocity cine magnetic resonance imaging. Vet Radiol Ultrasound. 2009;50:467-76.
30. Farke D, Dörn F, Schaub S, Wenz E, Büttner K, Schmidt MJ. CSF flow measurement in the mesencephalic aqueduct using 2D cine phase-contrast MRI in dogs with communicating internal hydrocephalus, ventriculomegaly, and physiologic ventricular spaces. Front Vet Sci. 2024;11:1473778.
31. Gupta S, Soellinger M, Boesiger P, Poulikakos D, Kurtcuoglu V. Three-dimensional computational modeling of subject-specific cerebrospinal fluid flow in the subarachnoid space. J Biomech Eng. 2009;131:021010.
32. Khani M, Lawrence BJ, Sass LR, et al. Characterization of intrathecal cerebrospinal fluid geometry and dynamics in cynomolgus monkeys (macaca fascicularis) by magnetic resonance imaging. PLoS One. 2019;14:e0212239.
33. Khani M, Sass LR, Xing T, Keith Sharp M, Balédent O, Martin BA. Anthropomorphic model of intrathecal cerebrospinal fluid dynamics within the spinal subarachnoid space: spinal cord nerve roots increase steady-streaming. J Biomech Eng. 2018;140:081012.
34. Heidari Pahlavian S, Yiallourou T, Tubbs RS, et al. The impact of spinal cord nerve roots and denticulate ligaments on cerebrospinal fluid dynamics in the cervical spine. PLoS One. 2014;9:e91888.
35. Linge SO, Haughton V, Løvgren AE, Mardal KA, Langtangen HP. CSF flow dynamics at the craniovertebral junction studied with an idealized model of the subarachnoid space and computational flow analysis. Am J Neuroradiol. 2010;31:185-92.
Cite This Article
 Open Access
How to Cite
Download Citation
Export Citation File:
Type of Import
Tips on Downloading Citation
Citation Manager File Format
Type of Import
Direct Import: When the Direct Import option is selected (the default state), a dialogue box will give you the option to Save or Open the downloaded citation data. Choosing Open will either launch your citation manager or give you a choice of applications with which to use the metadata. The Save option saves the file locally for later use.
Indirect Import: When the Indirect Import option is selected, the metadata is displayed and may be copied and pasted as needed.
About This Article
Special Topic
Copyright

Data & Comments
Data
0










Comments
Comments must be written in English. Spam, offensive content, impersonation, and private information will not be permitted. If any comment is reported and identified as inappropriate content by OAE staff, the comment will be removed without notice. If you have any queries or need any help, please contact us at support@oaepublish.com.