



Associations of cardiovascular-kidney-metabolic syndrome stage with trabecular bone score and bone mineral density
 0
0 Abstract
Aim: The cardiovascular-kidney-metabolic (CKM) syndrome highlights the interplay among cardiovascular, renal, and metabolic disorders. However, its relationship with the trabecular bone score (TBS) and bone mineral density (BMD) remains unclear. We aimed to evaluate the association between the CKM syndrome stage and bone health-related indicators.
Methods: Data from the 2005-2008 National Health and Nutrition Examination Survey were analyzed for 4,364 adults aged 30-79 years (median age 51 years; 51.9% male, 48.1% female). Bone health was assessed using TBS, femoral neck (FN) BMD, and lumbar spine (LS) BMD. Multivariate and segmented regression models were used to examine associations between CKM stages and TBS, FN BMD, and LS BMD.
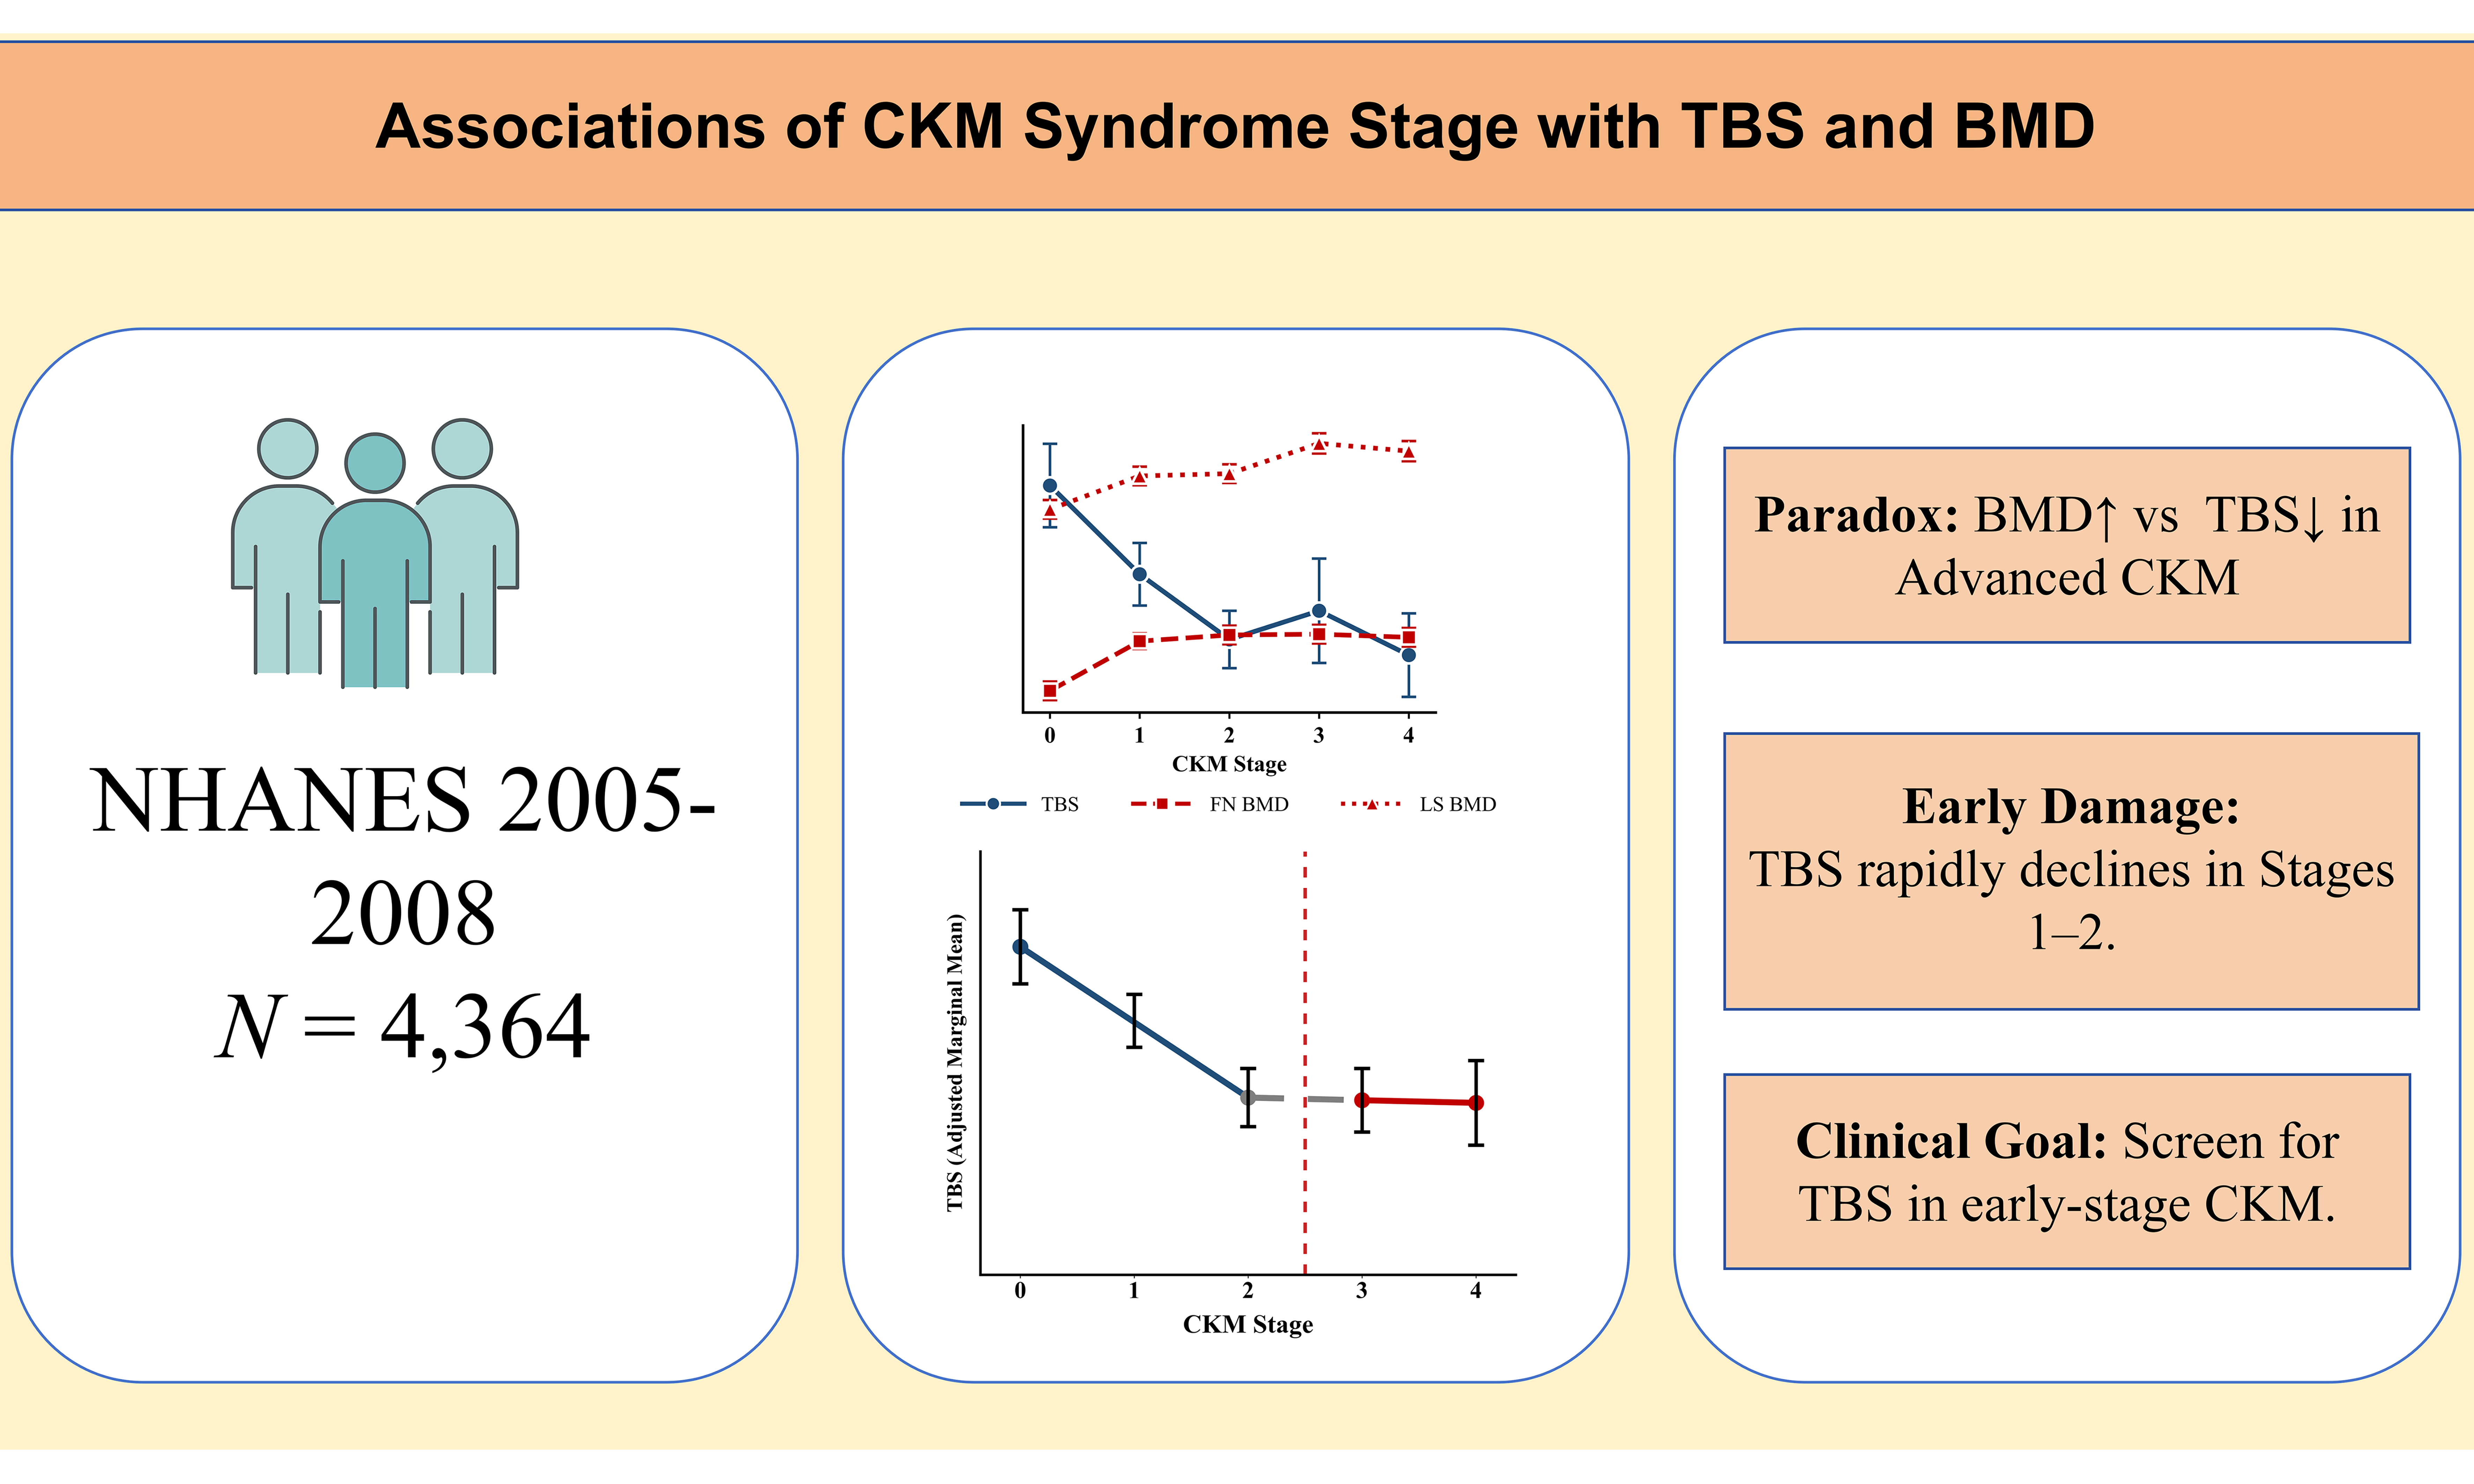
Results: Multivariate linear regression revealed a significant inverse correlation between CKM syndrome stage and TBS, which was predominantly observed across the early stages (0-2), while positive correlations were observed with FN BMD and LS BMD. No significant associations were found between CKM syndrome stage and osteoporosis or prior fractures.
Conclusion: This study revealed a previously unrecognized dissociation in CKM syndrome, in which advanced stages were associated with a lower overall TBS despite higher FN BMD and LS BMD. This discordant pattern parallels the well-established diabetic bone paradox, underscoring the insufficiency of BMD alone for fracture risk assessment in patients with CKM syndrome. A comprehensive evaluation incorporating the TBS is essential to accurately assess bone fragility. Concurrent TBS assessment during routine BMD testing is recommended for patients with early-stage CKM to enable early detection of microarchitectural deficits.
Keywords
INTRODUCTION
Osteoporosis is a widely recognised skeletal condition characterised by a decrease in bone mass, reduction in bone mineral density (BMD), and deterioration of bone microarchitecture, which collectively lead to weakened bone strength and increased likelihood of fractures[1]. In clinical practice, femoral neck (FN) BMD and lumbar spine (LS) BMD measured by dual-energy X-ray absorptiometry (DXA) are utilised as key assessments[2]. Additionally, the trabecular bone score (TBS), a texture index derived from DXA images of the lumbar region, quantitatively assesses trabecular microarchitecture and provides independent prediction of fracture risk, complementing the information obtained from BMD[3].
Cardiovascular-kidney-metabolic (CKM) syndrome[4,5], a novel concept recently introduced by the American Heart Association, represents a systemic disorder characterised by obesity, metabolic imbalance, insulin resistance, chronic kidney disease (CKD), and cardiovascular disease (CVD). This classification system categorises the overall health status of individuals into five distinct stages (0-4) according to the existence of risk factors and diagnosed conditions, providing a thorough evaluation. Previous studies have revealed associations among insulin resistance, CVD, CKD, body mass index (BMI), metabolic disorders, and bone health[6-10]. A recent longitudinal cohort investigation conducted using data from the UK Biobank[7] revealed that female individuals with osteoporosis exhibit an elevated prevalence of CVD, whereas male individuals with osteoporosis have an increased risk of CVD-related mortality. Miller et al. showed that patients with CKD are susceptible to metabolic bone disorders, inducing alterations in the quantity and quality of bone tissue and augmenting the likelihood of fractures[8]. Nonetheless, the association of the CKM syndrome stage with BMD and the TBS remains underexplored. Understanding this connection is essential for developing targeted strategies to improve bone health in individuals with CKM syndrome.
Therefore, in this study, we aimed to explore the relationship between the CKM syndrome stage and various bone health-related indicators, specifically the TBS, FN BMD, and LS BMD, utilising data obtained from the National Health and Nutrition Examination Survey (NHANES), 2005-2008.
METHODS
Ethical considerations
All protocols were conducted in compliance with the ethical guidelines of the NHANES Institutional Review Board and the 1975 Declaration of Helsinki (revised 2000). Approval from the Institutional Review Board was secured from the National Center for Health Statistics Research Ethics Review Board. Written informed consent was obtained from all individual participants included in the study.
Study design and population
We used data from NHANES, a continuous, cross-sectional, and multistage probability study aimed at evaluating the health and nutritional conditions of the civilian, non-institutionalised demographic in the United States. Comprehensive protocols, alongside publicly accessible datasets, can be found at (http://www.cdc.gov/nchs/nhanes.htm). We analysed data from the 2005-2008 NHANES cycles. Among the 20,497 examined individuals, the following were sequentially excluded: pregnant individuals, those lacking data on LS BMD and the TBS or compatible dual-site data, and individuals for whom the basic PREVENT equation could not yield a valid 10-year CVD risk. Additionally, participants with missing waist circumference data were excluded. Consequently, the final study population consisted of 4,364 participants aged 30-79 years. The flowchart detailing the inclusion and exclusion of participants is shown in Figure 1.
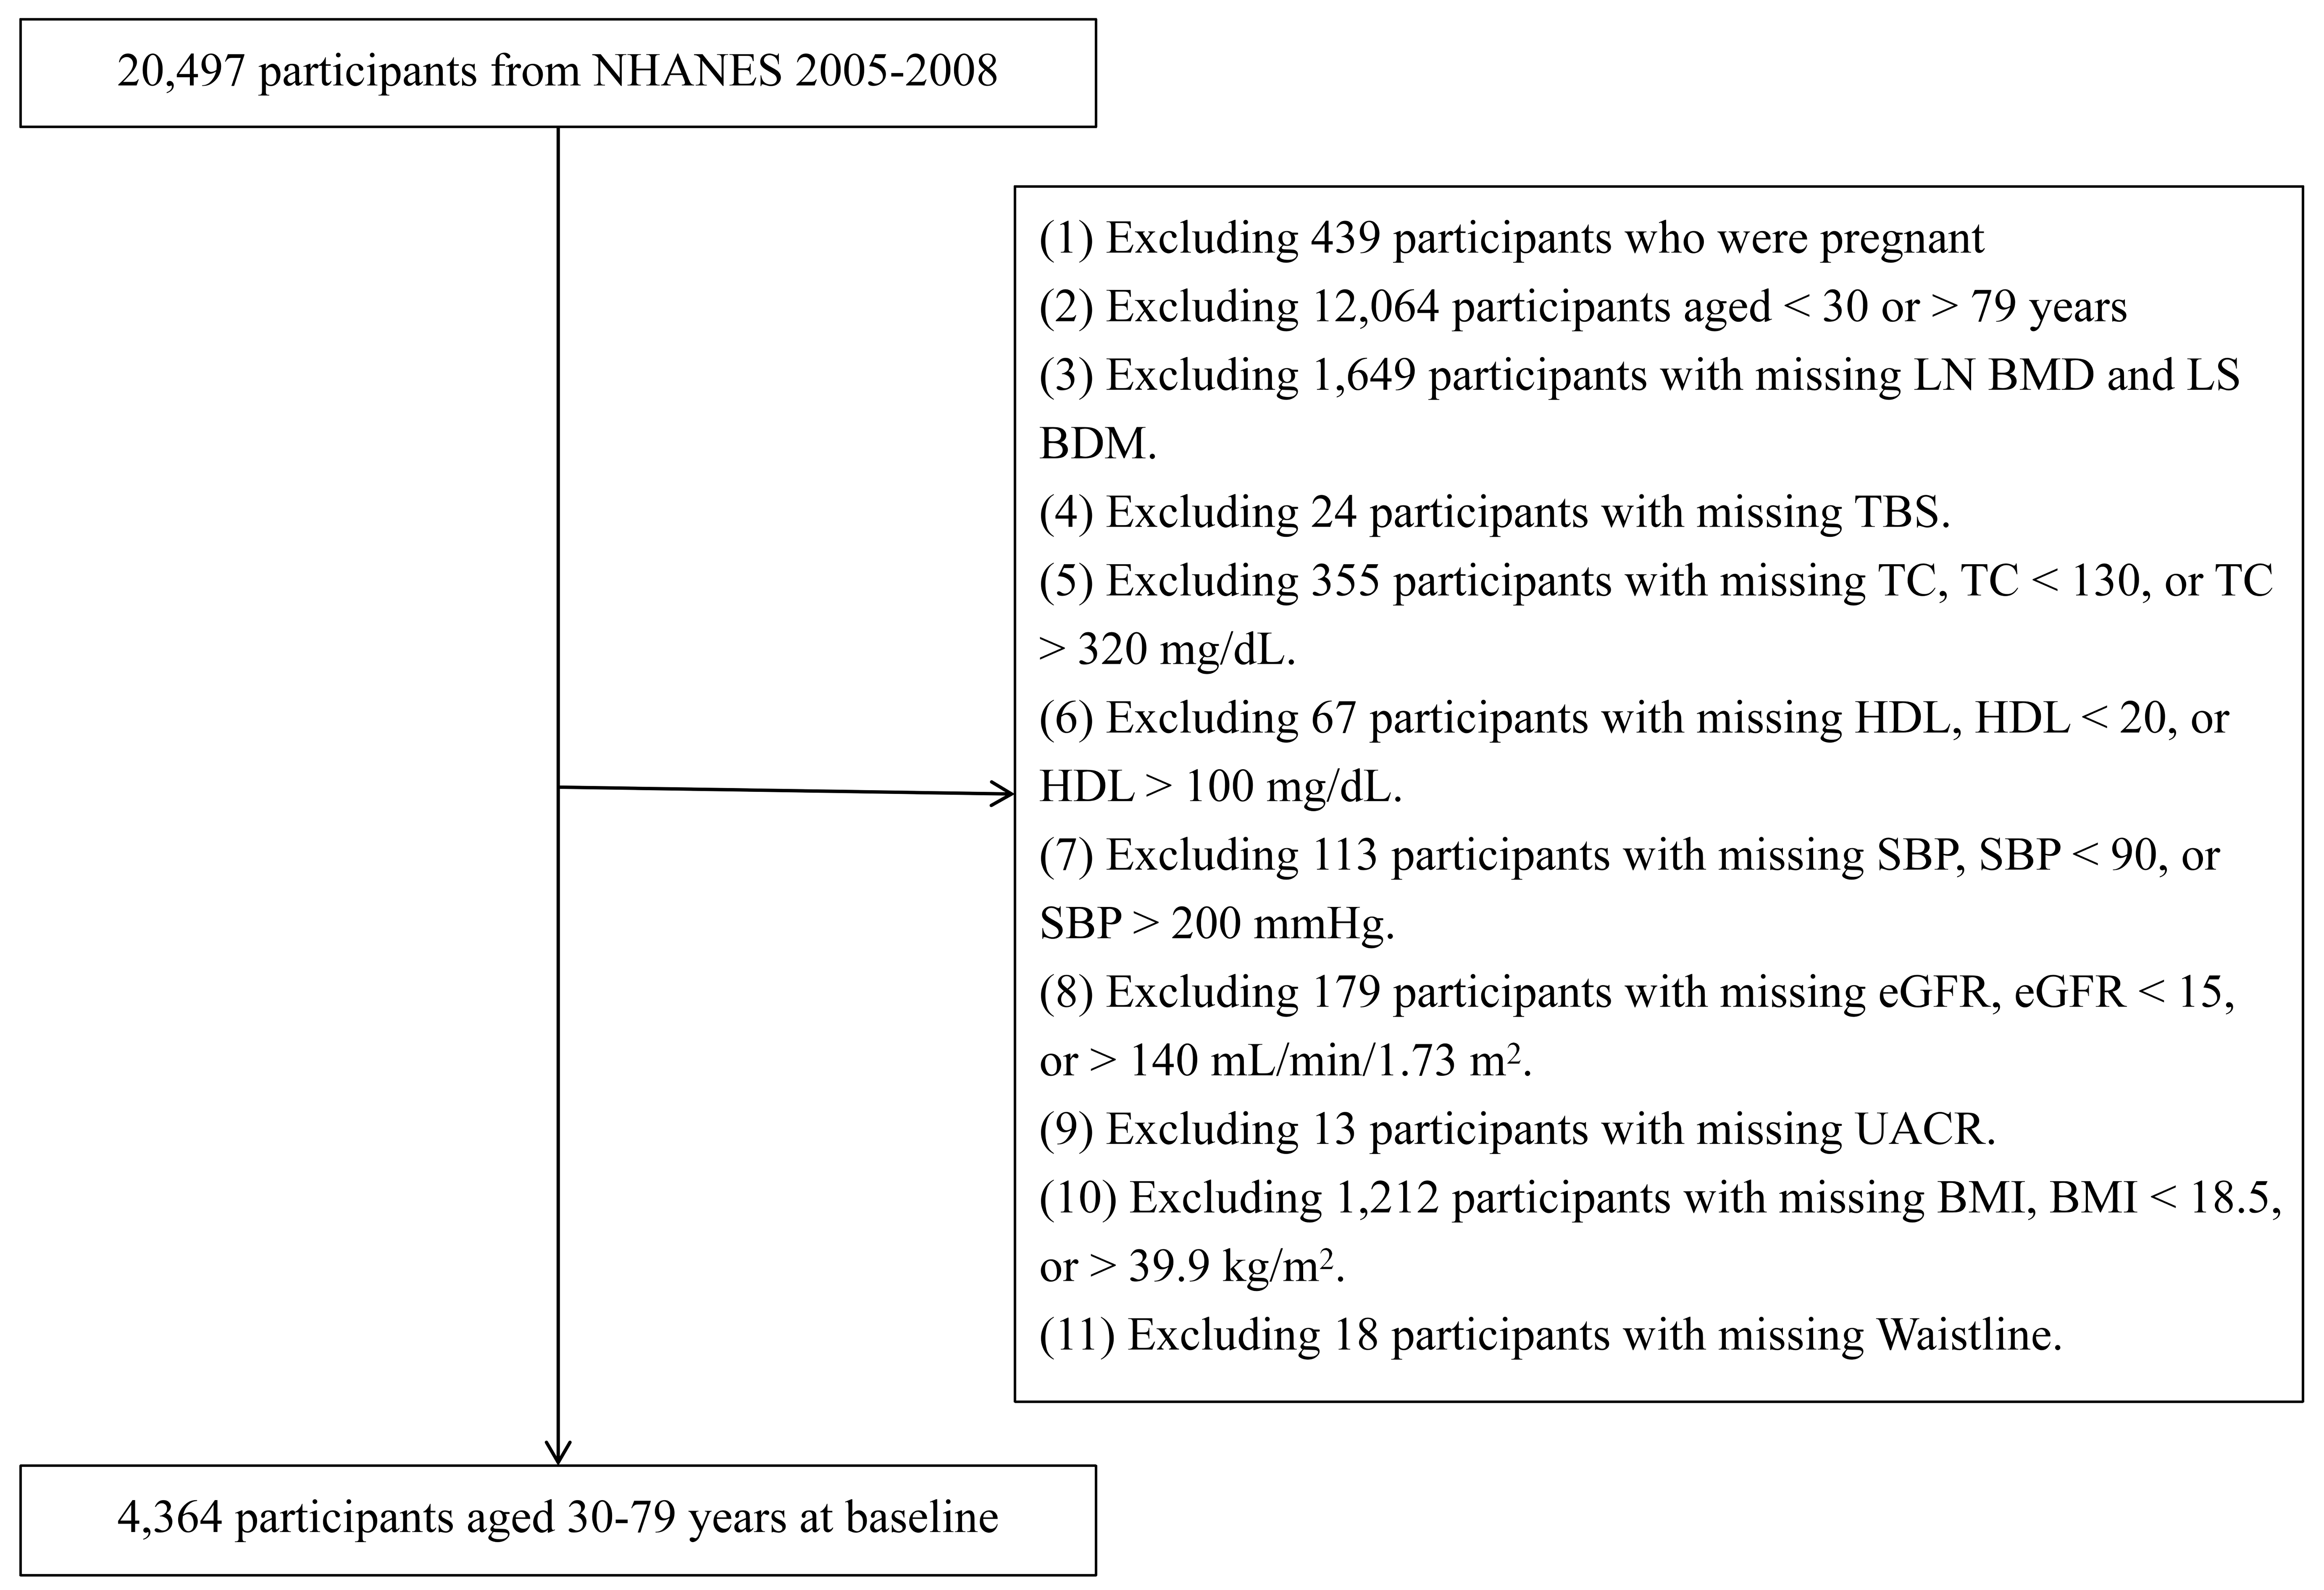
Figure 1. Study population flow diagram. NHANES: National Health and Nutrition Examination Survey; FN: femoral neck; LS: lumbar spine; BMD: bone mineral density; TBS: trabecular bone score; TC: total cholesterol; HDL: high-density lipoprotein; SBP: systolic blood pressure; eGFR: estimated glomerular filtration rate; UACR: urine albumin-to-creatinine ratio; BMI: body mass index.
Definitions of the CKM syndrome stages
The CKM syndrome stages were categorised in accordance with the guidelines presented in the 2023 American Heart Association Presidential Advisory[4,5]. The overall health status of participants was divided into five distinct stages (0-4) based on the presence of specific risk factors and clinical conditions. Stage 0 was identified in individuals whose BMI ranged from 18.5 to 24.9 kg/m2, with a waist circumference < 88 cm for female individuals and < 102 cm for male individuals, and those who did not meet the criteria for any higher stage. Stage 1 was identified in those who either had (a) a BMI ≥ 25 kg/m2 or an increased waist circumference (≥ 88 cm for female individuals; ≥ 102 cm for male individuals); or (b) were diagnosed with prediabetes or were undergoing pharmacological treatment for hyperglycemia. Stage 2 was identified in individuals exhibiting at least one of the following conditions: (a) metabolic risk factors, such as fasting serum triglyceride level ≥ 135 mg/dL, hypertension, diabetes, or metabolic syndrome; (b) CKD, classified as moderate or high risk according to Kidney Disease: Improving Global Outcomes criteria[11] [with an estimated glomerular filtration rate (eGFR) of 30-59 mL/min/1.73 m2 or a urine albumin-to-creatinine ratio (UACR) of 30-299 mg/g], calculated using the race-free Chronic Kidney Disease Epidemiology Collaboration 2021 creatinine equation[12]. Stage 3 was characterised by (a) very-high-risk CKD (with an eGFR < 30 mL/min/1.73 m2 or a UACR ≥ 300 mg/g); or (b) a projected 10-year risk of atherosclerotic CVD ≥ 20%; utilising a condensed CKM risk protocol, we calculated the 10-year likelihood of CVD (the detailed formula is provided in Supplementary Table 1). Stage 4 was defined by the presence of self-reported, physician-diagnosed conditions, such as coronary heart disease, angina, myocardial infarction, heart failure, or stroke. For CKM syndrome staging, a hierarchical prioritization rule was applied: individuals meeting clinical criteria for multiple stages were consistently classified into the highest applicable stage to reflect maximum severity.
Bone quality and mass assessment
Bone quality and mass were assessed using three parameters, namely the TBS, FN BMD, and LS BMD. The TBS, a metric obtained from the fluctuations in grey-levels observed in DXA scans of the LS, was computed utilising TBS software (Med-Imap SA TBS Calculator, version 2.1.0.2). The FN BMD and LS BMD were assessed through DXA using Hologic QDR-4500A fan-beam densitometers. Additionally, binary bone outcomes were derived from the NHANES questionnaire: osteoporosis was operationalized as a self-reported physician diagnosis (item OSQ060: “Ever told had osteoporosis or brittle bones”), and prior fractures were identified based on affirmative responses to doctor-diagnosed fractures.
Other covariates
Covariates were selected based on biological plausibility and established associations with both CKM syndrome and bone health outcomes, encompassing demographic factors, biochemical markers, lifestyle and nutritional factors, and comorbidities/medication use. Additional covariates included age, sex, race, poverty-income ratio, marital status, education level, total calcium intake, vitamin D supplementation, physical activity level, alcohol consumption, history of rheumatoid arthritis, history of cancer or malignancy, history of glucocorticoid use, history of female hormone use, and current anti-osteoporosis drug use, as well as levels of biochemical markers such as serum 25-hydroxyvitamin D, serum phosphorus, serum calcium, serum alkaline phosphatase, and serum uric acid. Total calcium intake includes both dietary sources and supplements; Alcohol consumption was classified into four categories using NHANES standardized definitions: Never (lifetime intake < 12 drinks), Former (≥ 12 drinks in lifetime but none in the past 12 months), Current moderate (≤ 1 drink/day for women or ≤ 2 drinks/day for men, without binge drinking), and Current heavy (> 1 drink/day for women or > 2 drinks/day for men, or presence of binge drinking). Physical activity level was categorized using metabolic equivalent of task (MET-min/week) into four groups: No activity (0 MET-min/week), Insufficiently active (1-599), Sufficiently active (600-2,999), and Highly active (≥ 3,000). Current anti-osteoporosis medication use included bisphosphonates, selective estrogen receptor modulators, and denosumab.
Statistical analysis
Statistical analyses were conducted using EmpowerStats v4.2, EmpowerXYS 6.0, R v4.3.2, and Python. Continuous variables were presented as means with corresponding 95% confidence intervals (95%CI) or as medians with interquartile ranges, whereas categorical variables were expressed as absolute counts and percentages. Statistical significance was assessed using the Kruskal-Wallis rank-sum test for continuous variables and Fisher’s exact probability test for categorical variables with expected values less than 10. A significance threshold was set at P < 0.05. Three analytical models were developed: model 1 served as the unadjusted baseline; model 2 incorporated adjustments for age, sex, and race/ethnicity; and model 3 included comprehensive adjustments for all relevant covariates, including age, sex, race, poverty-income ratio, marital status, and education level, serum 25-hydroxyvitamin D, serum phosphorus, serum calcium, serum alkaline phosphatase, and uric acid, total calcium intake, vitamin D supplementation, alcohol consumption, physical activity level, history of glucocorticoid use, female hormone use, rheumatoid arthritis, cancer or malignancy and current anti-osteoporosis drug use. Adjusted marginal means of TBS, FN BMD, and LS BMD across CKM stages were estimated from Model 3 and visualized using dual-axis line graphs. Furthermore, subgroup analyses were conducted to evaluate the association between the CKM syndrome stage and bone health-related indicators (TBS, FN BMD, and LS BMD) across demographic and clinical subgroups. In these models, all covariates included in Model 3 were adjusted for, with the exception of the stratifying variable itself. Interaction terms were incorporated to evaluate the potential modifying effects of each subgroup variable on these associations. Additionally, the proportional odds assumption was tested using ordinal regression models. Piecewise linear regression with a breakpoint between CKM stages 2 and 3 was performed to examine differential associations between early (stages 0-2) and late (stages 3-4) CKM status and bone outcomes. This breakpoint was established a priori based on clinical relevance. It represents the fundamental pathophysiological watershed in the CKM taxonomy - transitioning from simple metabolic risk factors to overt target organ damage - allowing us to specifically evaluate bone parameters across this critical clinical threshold.
RESULTS
Clinical characteristics at baseline
Among the 4,364 eligible participants, the proportions of those with CKM stages 0-4 were 12.3%, 33.5%, 41.0%, 4.8%, and 8.3%, respectively. Age increased sequentially from the group of participants with stage 0 to those with stage 3 (median ages: 42, 45, 52, and 74 years, respectively; P < 0.001), declined slightly in the group with stage 4 (64 years), and remained significantly higher in those with stages 0-2 (all P < 0.001). A male predominance was observed among the participants with advanced stages (P < 0.001); the proportion of male individuals increased from the group with stage 0 (40.90%) to those with stage 3 (63.51%), and declined slightly in the group with stage 4 (63.09%). Race differed across the groups with different CKM syndrome stages (P < 0.001). The Non-Hispanic White population remained the largest subgroup despite their proportion decreasing from 60.22% to 53.72%, whereas the proportion of non-Hispanic Blacks increased from 10.78% to 23.14%. Socioeconomic indicators deteriorated in more advanced CKM syndrome stages. The percentage of individuals who completed high school decreased from 79.93% to 63.91%, and the proportion with a poverty-income ratio > 3 declined from 55.21% to 30.38% (both P < 0.001). Consistent with higher CKM stages, serum 25-hydroxyvitamin D levels decreased (P < 0.001), whereas alkaline phosphatase and uric acid levels increased (both P < 0.001). Calcium levels showed no clinically relevant difference (P = 0.053), whereas phosphorus levels varied significantly but minimally (P < 0.001) based on CKM syndrome stage. Additionally, total calcium intake generally decreased at more advanced stages (P < 0.001). Alcohol consumption patterns (P < 0.001) and physical activity levels (P < 0.001) varied significantly across the CKM syndrome stages, with a higher proportion of physical inactivity observed in advanced stages. However, history of glucocorticoid use, rheumatoid arthritis, and cancer or malignancy was more prevalent among individuals with advanced CKM syndrome stages (all P < 0.001). In contrast, vitamin D supplementation (P = 0.178) and its dosage among users (P = 0.645), as well as current anti-osteoporosis drug use (P = 0.144), did not differ significantly across the groups [Table 1].
Clinical characteristics of the participants with various cardiovascular-kidney-metabolic syndrome stages at baseline
| Variable | Stage 0 (N% = 12.3%) | Stage 1 (N% = 33.5%) | Stage 2 (N% = 41.0%) | Stage 3 (N% = 4.8%) | Stage 4 (N% = 8.3%) | P-value |
| Age (years) | 42.00 (36.00-51.00) | 45.00 (38.00-54.00) | 52.00 (43.00-62.00) | 74.00 (69.00-77.00) | 64.00 (56.00-71.00) | < 0.001 |
| Serum Vit D level (nmol/L) | 67.60 (52.77-81.00) | 59.00 (44.70-73.97) | 59.10 (44.40-73.80) | 61.60 (47.95-75.15) | 56.80 (39.80-71.80) | < 0.001 |
| ALP level (U/L) | 60.00 (48.00-71.00) | 65.00 (54.00-77.00) | 69.00 (57.00-83.00) | 71.00 (56.00-87.50) | 72.00 (59.00-87.00) | < 0.001 |
| Ca level (mg/dL) | 9.40 (9.20-9.70) | 9.40 (9.20-9.60) | 9.50 (9.20-9.70) | 9.50 (9.20-9.65) | 9.40 (9.20-9.70) | 0.053 |
| P level (mg/dL) | 3.80 (3.50-4.10) | 3.70 (3.40-4.10) | 3.70 (3.30-4.10) | 3.70 (3.35-4.00) | 3.70 (3.30-4.10) | < 0.001 |
| UA level (mg/dL) | 4.40 (3.80-5.40) | 5.20 (4.40-6.10) | 5.60 (4.70-6.50) | 5.90 (4.90-6.70) | 5.90 (4.80-7.05) | < 0.001 |
| Total calcium intake(mg/day) | 1,040.00 (701.38-1,455.50) | 963.25 (655.50-1,386.00) | 969.50 (640.00-1,380.00) | 791.00 (579.62-1,203.88) | 823.25 (568.25-1,225.00) | < 0.001 |
| Vit D supplementation | 0.178 | |||||
| No | 412 (76.58%) | 1,141 (77.99%) | 1,403 (78.42%) | 150 (71.09%) | 281 (77.41%) | |
| Yes | 126 (23.42%) | 322 (22.01%) | 386 (21.58%) | 61 (28.91%) | 82 (22.59%) | |
| Among users (IU/day) | 400.00 (400.00-600.00) | 400.00 (400.00-800.00) | 400.00 (400.00-700.00) | 400.00 (400.00-500.00) | 400.00 (400.00-800.00) | 0.645 |
| Sex | < 0.001 | |||||
| Male | 220 (40.89%) | 768 (52.49%) | 916 (51.20%) | 134 (63.51%) | 229 (63.09%) | |
| Female | 318 (59.11%) | 695 (47.51%) | 873 (48.80%) | 77 (36.49%) | 134 (36.91%) | |
| Menopausal history | < 0.001 | |||||
| No | 230 (72.33%) | 428 (61.58%) | 333 (38.14%) | 6 (7.79%) | 21 (15.67%) | |
| Yes | 88 (27.67%) | 267 (38.42%) | 540 (61.86%) | 71 (92.21%) | 113 (84.33%) | |
| Race | < 0.001 | |||||
| Mexican American | 78 (14.50%) | 317 (21.67%) | 359 (20.07%) | 35 (16.59%) | 51 (14.05%) | |
| Other Hispanic | 41 (7.62%) | 139 (9.50%) | 157 (8.78%) | 18 (8.53%) | 19 (5.23%) | |
| Non-Hispanic White | 324 (60.22%) | 712 (48.67%) | 876 (48.97%) | 116 (54.98%) | 195 (53.72%) | |
| Non-Hispanic Black | 58 (10.78%) | 232 (15.86%) | 312 (17.44%) | 39 (18.48%) | 84 (23.14%) | |
| Other race | 37 (6.88%) | 63 (4.31%) | 85 (4.75%) | 3 (1.42%) | 14 (3.86%) | |
| Marital status | < 0.001 | |||||
| Married | 343 (63.87%) | 911 (62.31%) | 1,162 (64.95%) | 141 (66.82%) | 217 (59.78%) | |
| Single | 150 (27.93%) | 456 (31.19%) | 530 (29.63%) | 70 (33.18%) | 133 (36.64%) | |
| Living with partner | 44 (8.19%) | 95 (6.50%) | 97 (5.42%) | 0 (0.00%) | 13 (3.58%) | |
| Education level | < 0.001 | |||||
| Below high school | 108 (20.07%) | 344 (23.55%) | 481 (26.89%) | 90 (42.65%) | 131 (36.09%) | |
| High school or higher | 430 (79.93%) | 1,117 (76.45%) | 1,308 (73.11%) | 121 (57.35%) | 232 (63.91%) | |
| PIR | < 0.001 | |||||
| < 1.0 | 71 (13.95%) | 219 (15.99%) | 262 (15.50%) | 25 (12.89%) | 75 (22.12%) | |
| 1.0-3.0 | 157 (30.84%) | 492 (35.91%) | 645 (38.17%) | 119 (61.34%) | 161 (47.49%) | |
| > 3.0 | 281 (55.21%) | 659 (48.10%) | 783 (46.33%) | 50 (25.77%) | 103 (30.38%) | |
| Alcohol consumption | < 0.001 | |||||
| Never | 64 (12.50%) | 160 (11.24%) | 206 (11.83%) | 45 (21.95%) | 33 (9.19%) | |
| Former | 64 (12.50%) | 238 (16.71%) | 358 (20.56%) | 63 (30.73%) | 139 (38.72%) | |
| Current moderate | 216 (42.19%) | 583 (40.94%) | 709 (40.72%) | 69 (33.66%) | 127 (35.38%) | |
| Current heavy | 168 (32.81%) | 443 (31.11%) | 468 (26.88%) | 28 (13.66%) | 60 (16.71%) | |
| Physical activity level | < 0.001 | |||||
| No activity | 121 (22.49%) | 397 (27.14%) | 526 (29.40%) | 89 (42.18%) | 156 (42.98%) | |
| Insufficiently active | 100 (18.59%) | 270 (18.46%) | 329 (18.39%) | 42 (19.91%) | 65 (17.91%) | |
| Sufficiently active | 178 (33.09%) | 417 (28.50%) | 544 (30.41%) | 51 (24.17%) | 85 (23.42%) | |
| Highly active | 139 (25.84%) | 379 (25.91%) | 390 (21.80%) | 29 (13.74%) | 57 (15.70%) | |
| History of glucocorticoid use | < 0.001 | |||||
| No | 514 (96.44%) | 1,398 (96.15%) | 1,687 (94.88%) | 205 (97.16%) | 323 (89.47%) | |
| Yes | 19 (3.56%) | 56 (3.85%) | 91 (5.12%) | 6 (2.84%) | 38 (10.53%) | |
| History of female hormone use | < 0.001 | |||||
| No | 280 (52.04%) | 896 (61.24%) | 1,088 (60.82%) | 165 (78.20%) | 255 (70.25%) | |
| Yes | 258 (47.96%) | 567 (38.76%) | 701 (39.18%) | 46 (21.80%) | 108 (29.75%) | |
| History of rheumatoid arthritis | < 0.001 | |||||
| No | 525 (97.58%) | 1,415 (96.72%) | 1,702 (95.14%) | 197 (93.36%) | 316 (87.05%) | |
| Yes | 13 (2.42%) | 48 (3.28%) | 87 (4.86%) | 14 (6.64%) | 47 (12.95%) | |
| History of cancer or malignancy | < 0.001 | |||||
| No | 504 (93.68%) | 1,379 (94.39%) | 1,629 (91.26%) | 165 (78.20%) | 302 (83.20%) | |
| Yes | 34 (6.32%) | 82 (5.61%) | 156 (8.74%) | 46 (21.80%) | 61 (16.80%) | |
| Current anti-osteoporosis drug use | 0.144 | |||||
| No | 525 (97.58%) | 1,430 (97.74%) | 1,740 (97.26%) | 200 (94.79%) | 351 (96.69%) | |
| Yes | 13 (2.42%) | 33 (2.26%) | 49 (2.74%) | 11 (5.21%) | 12 (3.31%) | |
Multivariate analysis of the CKM syndrome stages and bone quality and mass: dissociation of the CKM syndrome stages from BMD and the TBS
Multivariate linear regression analysis indicated that, in model 3, the CKM syndrome stage was inversely associated with the TBS. Compared with stage 0, the β coefficients (95%CI) for stages 1-4 were -0.03 (-0.05, -0.02), -0.06 (-0.07, -0.05), -0.05 (-0.07, -0.03), and -0.07 (-0.08, -0.05), respectively (all P < 0.001). In contrast, the CKM syndrome stage exhibited a positive and linear correlation with FN BMD and LS BMD. The β coefficients (95%CI) for stages 1-4 respectively were 0.07 (0.05, 0.08), 0.07 (0.06, 0.09), 0.08 (0.06, 0.10), and 0.07 (0.05, 0.09) for FN BMD and 0.05 (0.03, 0.06), 0.05 (0.04, 0.07), 0.09 (0.06, 0.11), and 0.08 (0.05, 0.10) for LS BMD (all P < 0.001).
Multivariate logistic regression analysis revealed that the CKM syndrome stage was not significantly associated with osteoporosis or prior fractures in the fully adjusted model (Model 3) [Table 2].
Multivariable linear and logistic regression models evaluating the association between CKM syndrome stages and bone health outcomes
| Variable | Stage 0 | Stage 1 | Stage 2 | Stage 3 | Stage 4 | P for trend |
| Continuous variable | β (95%CI) P-value | β (95%CI) P-value | β (95%CI) P-value | β (95%CI) P-value | ||
| TBS | ||||||
| Model 1 | Reference | -0.06 (-0.07, -0.05) < 0.0001 | -0.11 (-0.12, -0.10) < 0.0001 | -0.17 (-0.19, -0.15) < 0.0001 | -0.16 (-0.18, -0.15) < 0.0001 | < 0.0001 |
| Model 2 | Reference | -0.05 (-0.06, -0.04) < 0.0001 | -0.08 (-0.10, -0.07) < 0.0001 | -0.07 (-0.09, -0.05) < 0.0001 | -0.10 (-0.12, -0.09) < 0.0001 | < 0.0001 |
| Model 3 | Reference | -0.03 (-0.05, -0.02) < 0.0001 | -0.06 (-0.07, -0.05) < 0.0001 | -0.05 (-0.07, -0.03) < 0.0001 | -0.07 (-0.08, -0.05) < 0.0001 | < 0.0001 |
| FN BMD (g/cm2) | ||||||
| Model 1 | Reference | 0.07 (0.06, 0.08) < 0.0001 | 0.05 (0.04, 0.07) < 0.0001 | -0.02 (-0.04, 0.00) 0.0595 | 0.02 (-0.00, 0.03) 0.1035 | 0.0169 |
| Model 2 | Reference | 0.07 (0.06, 0.08) < 0.0001 | 0.08 (0.06, 0.09) < 0.0001 | 0.07 (0.05, 0.10) < 0.0001 | 0.07 (0.05, 0.09) < 0.0001 | < 0.0001 |
| Model 3 | Reference | 0.07 (0.05, 0.08) < 0.0001 | 0.07 (0.06, 0.09) < 0.0001 | 0.08 (0.06, 0.10) < 0.0001 | 0.07 (0.05, 0.09) < 0.0001 | < 0.0001 |
| LS BMD (g/cm2) | ||||||
| Model 1 | Reference | 0.05 (0.03, 0.06) < 0.0001 | 0.04 (0.02, 0.05) < 0.0001 | 0.03 (0.00, 0.05) 0.0258 | 0.05 (0.03, 0.07) < 0.0001 | 0.0034 |
| Model 2 | Reference | 0.05 (0.03, 0.06) < 0.0001 | 0.05 (0.04, 0.07) < 0.0001 | 0.08 (0.06, 0.11) < 0.0001 | 0.07 (0.05, 0.09) < 0.0001 | < 0.0001 |
| Model 3 | Reference | 0.05 (0.03, 0.06) < 0.0001 | 0.05 (0.04, 0.07) < 0.0001 | 0.09 (0.06, 0.11) < 0.0001 | 0.08 (0.05, 0.10) < 0.0001 | < 0.0001 |
| Binary variable | OR (95%CI) P-value | OR (95%CI) P-value | OR (95%CI) P-value | OR (95%CI) P-value | ||
| Osteoporosis (yes or no) | ||||||
| Model 1 | Reference | 0.91 (0.55, 1.49) 0.7034 | 1.23 (0.77, 1.97) 0.3782 | 1.97 (1.03, 3.77) 0.0401 | 2.88 (1.70, 4.89) < 0.0001 | < 0.0001 |
| Model 2 | Reference | 0.89 (0.52, 1.50) 0.6540 | 0.75 (0.45, 1.24) 0.2604 | 0.55 (0.26, 1.16) 0.1148 | 1.43 (0.79, 2.61) 0.2406 | 0.3345 |
| Model 3 | Reference | 1.01 (0.52, 1.97) 0.9821 | 0.94 (0.49, 1.80) 0.8456 | 0.69 (0.27, 1.75) 0.4299 | 2.08 (0.95, 4.53) 0.0660 | 0.0600 |
| Prior fracture (yes or no) | ||||||
| Model 1 | Reference | 0.82 (0.61, 1.12) 0.2143 | 0.95 (0.71, 1.27) 0.7253 | 1.10 (0.69, 1.76) 0.6855 | 1.34 (0.92, 1.96) 0.1271 | 0.0289 |
| Model 2 | Reference | 0.83 (0.61, 1.14) 0.2540 | 0.93 (0.68, 1.25) 0.6170 | 0.97 (0.57, 1.64) 0.9046 | 1.21 (0.80, 1.82) 0.3752 | 0.2234 |
| Model 3 | Reference | 0.79 (0.56, 1.12) 0.1850 | 0.97 (0.69, 1.36) 0.8500 | 0.86 (0.48, 1.53) 0.6064 | 1.12 (0.70, 1.78) 0.6444 | 0.2997 |
Adjusted marginal means of TBS, FN BMD, and LS BMD across CKM syndrome stages
To further illustrate the divergent trajectories of bone quality and bone mass across the CKM syndrome stages, we calculated the adjusted marginal means of the TBS, FN BMD, and LS BMD based on the fully adjusted model (Model 3). As depicted in Figure 2 and Supplementary Table 2 of the additional file, a clear dissociation was observed. The adjusted marginal mean of the TBS demonstrated an overall downward trend, decreasing from 1.413 (95%CI: 1.402-1.425) in stage 0 to its lowest point of 1.348 (95%CI: 1.335-1.361) in stage 4. Conversely, the adjusted marginal means of both FN BMD and LS BMD exhibited an initial significant increase from stage 0 to stage 1, followed by a plateau or slight upward trajectory through the more advanced stages. These visual trends robustly corroborate the inverse association of advanced CKM syndrome with microarchitectural bone quality, despite the paradoxical preservation or increase in areal bone density.
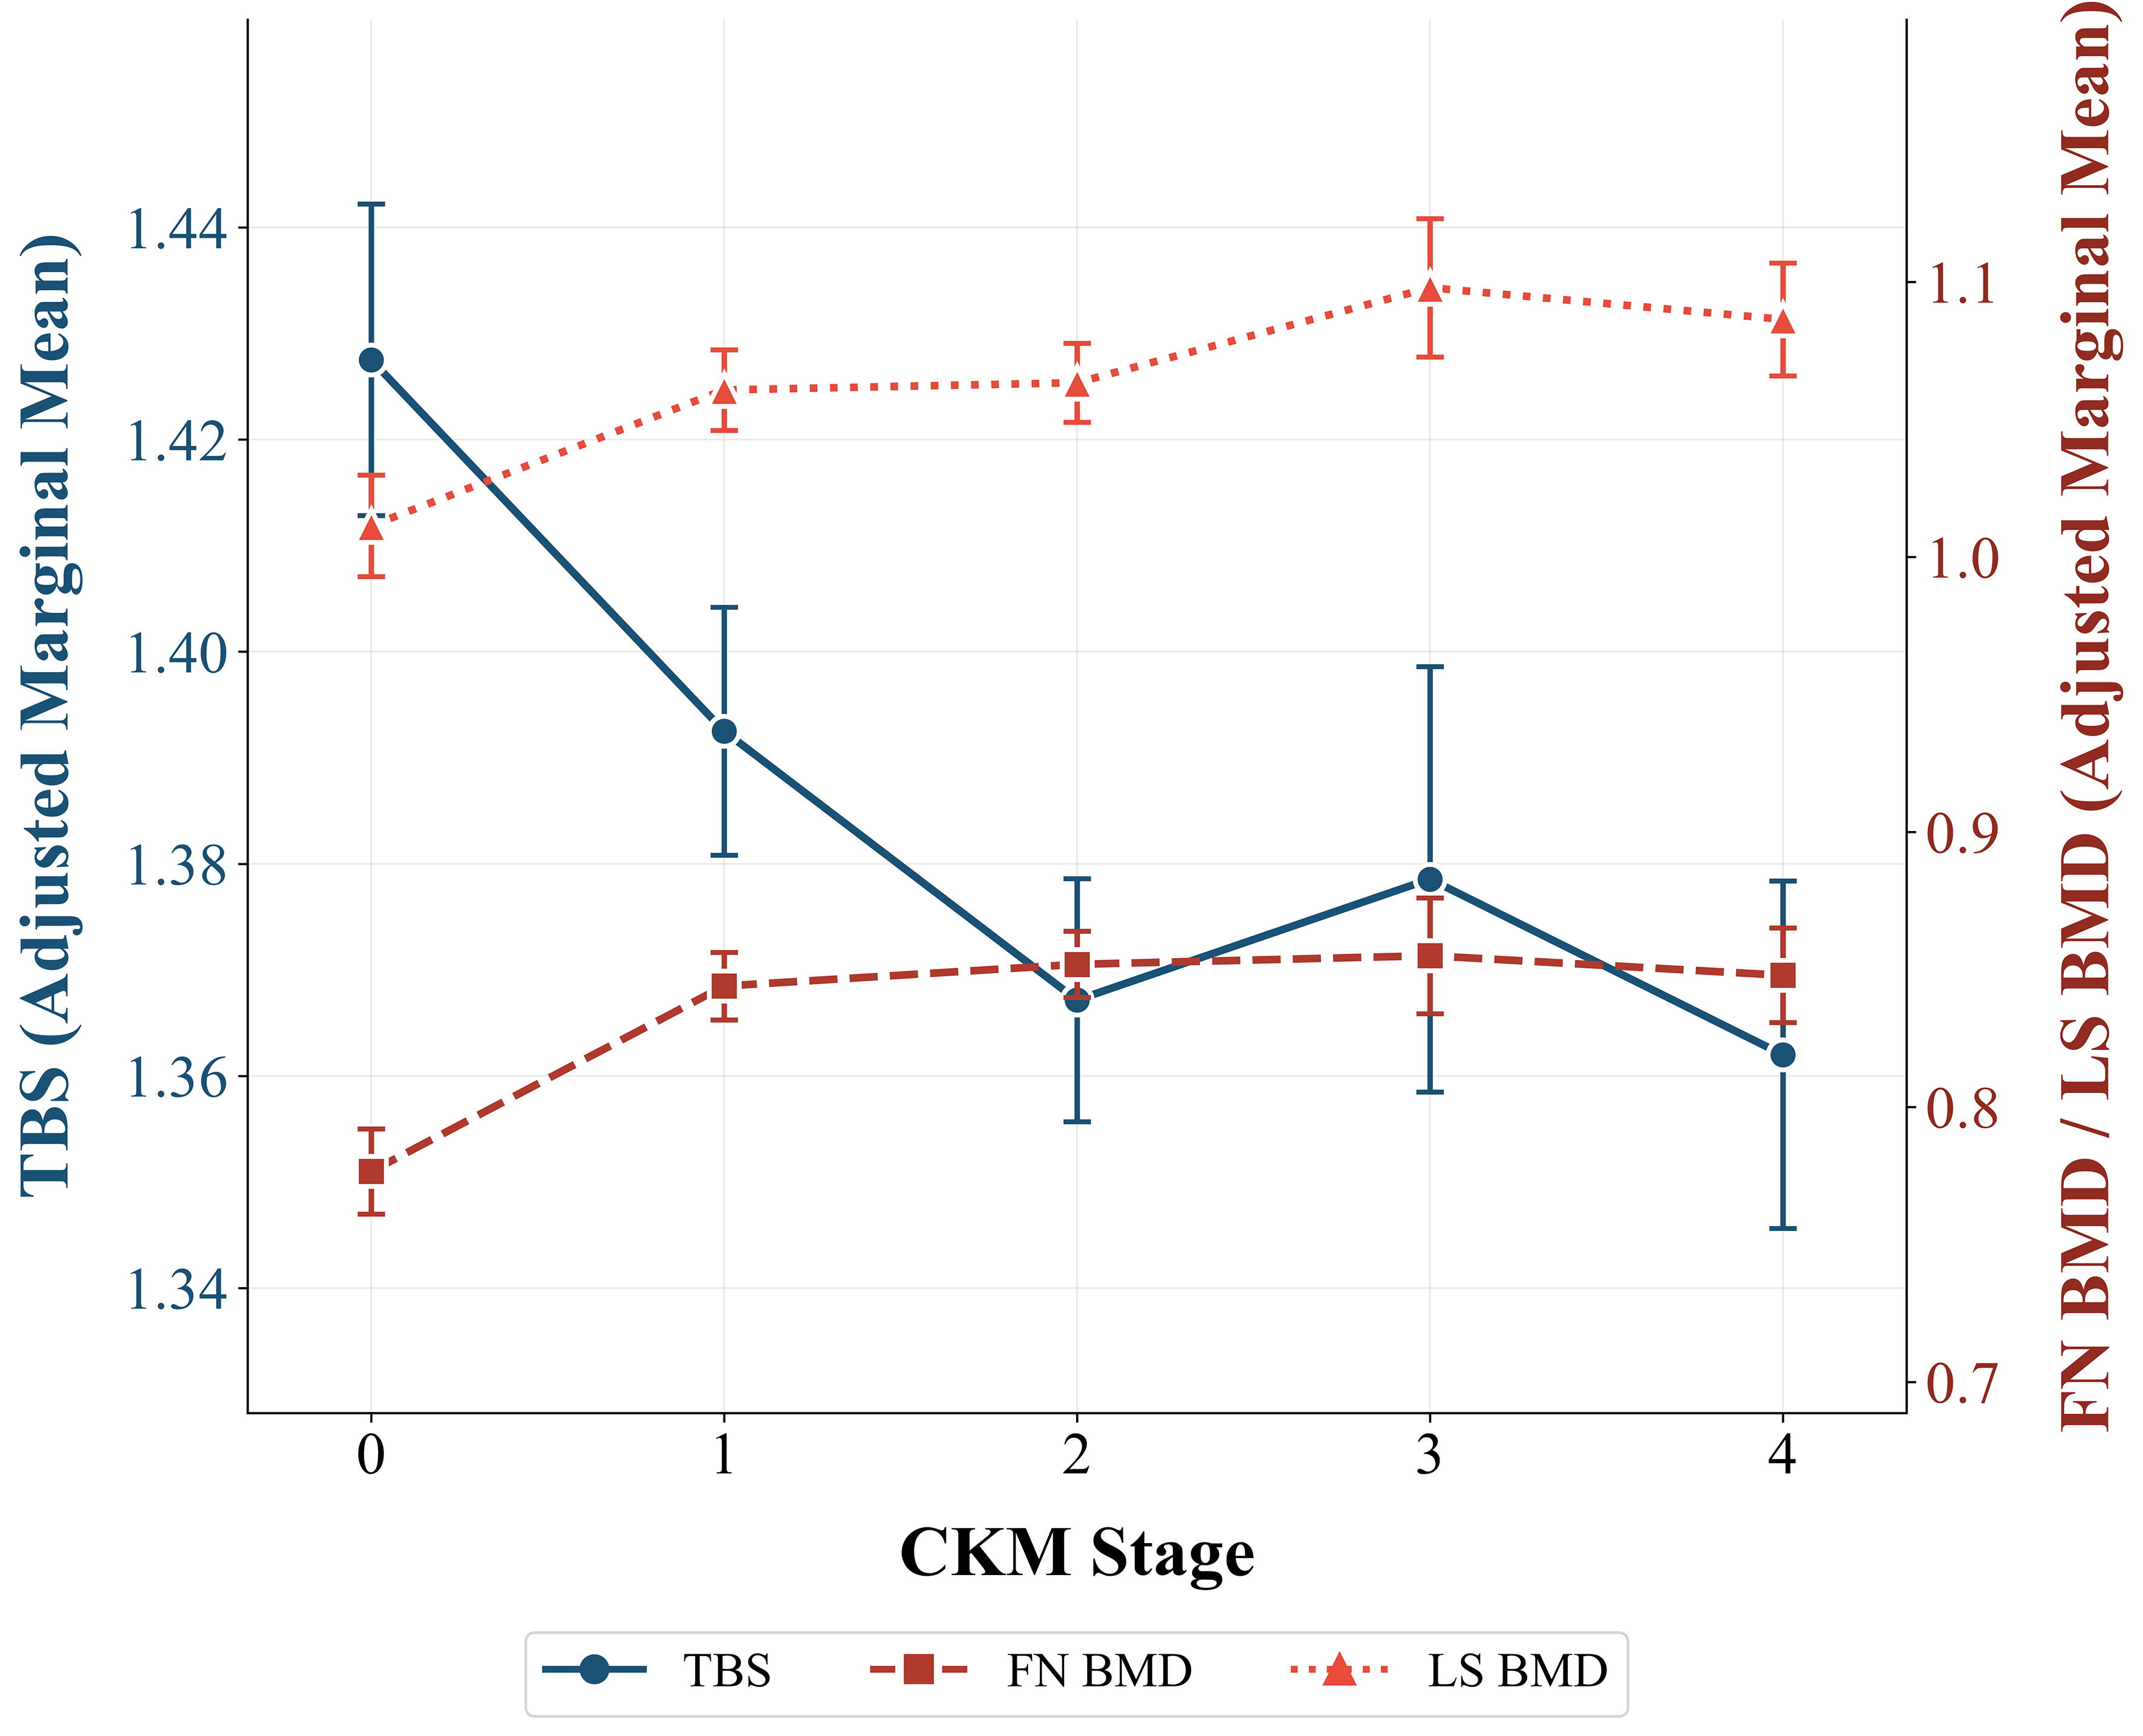
Figure 2. Adjusted marginal means of TBS, FN BMD, and LS BMD across CKM syndrome stages; TBS (unitless) and BMD (g/cm2) are presented on separate y-axes due to their distinct measurement scales and variation ranges. The visual intersection of the trend lines does not imply mathematical equivalence but illustrates the discordant trajectories of microarchitectural degradation (declining TBS) and areal bone density preservation (increasing BMD) with advancing CKM stages. CKM: Cardiovascular-kidney-metabolic; TBS: trabecular bone score; FN: femoral neck; LS: lumbar spine; BMD: bone mineral density.
Segmented regression analysis
To evaluate non-linear trends and potential threshold effects in the adjusted marginal means, a segmented regression analysis was performed with a predefined breakpoint between CKM syndrome stages 2 and 3. For the TBS, a significant and sharp decline was observed during the early-to-intermediate stages (stages 0-2), with a slope of -0.0288 (95%CI: -0.0347 to -0.0229; P < 0.0001). However, as the syndrome advanced to stages 3-4, the trajectory plateaued, and the slope was no longer significantly different from zero (slope = -0.0011; P = 0.7566). The change in slope (Δ slope) was statistically significant (0.0277; P < 0.0001). Regarding areal BMD, FN BMD exhibited a corresponding threshold effect, with its significant increase confined to the early stages before plateauing (Δ slope = -0.0344; P < 0.0001). In contrast, LS BMD demonstrated a more consistent and linear increase across all CKM syndrome stages, with no statistically significant change in slope (Δ slope = -0.0092; P = 0.1457) [Table 3 and Supplementary Figure 1].
Segmented regression results
| Variable | Stage | Slope | 95%CI | P-value |
| TBS | Stages 0-2 | -0.0288 | (-0.0347, -0.0229) | < 0.0001 |
| Stages 3-4 | -0.0011 | (-0.0081, 0.0059) | 0.7566 | |
| Δ slope | 0.0277 | (0.0177, 0.0376) | < 0.0001 | |
| FN BMD | Stages 0-2 | 0.0298 | (0.0235, 0.0360) | < 0.0001 |
| Stages 3-4 | -0.0046 | (-0.0120, 0.0028) | 0.2217 | |
| Δ slope | -0.0344 | (-0.0449, -0.0240) | < 0.0001 | |
| LS BMD | Stages 0-2 | 0.0200 | (0.0126, 0.0275) | < 0.0001 |
| Stages 3-4 | 0.0108 | (0.0020, 0.0196) | 0.0164 | |
| Δ slope | -0.0092 | (-0.0217, 0.0032) | 0.1457 |
Subgroup analyses
Subgroup analyses consistently showed an inverse relationship between CKM syndrome stage and TBS. Interaction tests revealed no significant differences based on age, poverty-income ratio, education level, marital status, menopausal history, physical activity level, alcohol consumption, or history of glucocorticoid use, rheumatoid arthritis, or cancer or malignancy (all P-interaction > 0.05). However, the inverse association between TBS and higher CKM syndrome stages was significantly greater in male individuals than in female individuals (P-interaction = 0.0397). Additionally, significant interactions were observed for race (P-interaction = 0.0333) and current anti-osteoporosis drug use (P-interaction = 0.0010). The inverse association between CKM syndrome stage and TBS was prominent among non-users of anti-osteoporosis drugs but attenuated in users. For FN BMD and LS BMD, the positive associations with the CKM syndrome stage remained significant and directionally consistent across subgroups. Interaction tests showed no significant effect modification by sex, menopausal history, age, poverty-income ratio, education level, marital status, alcohol consumption, physical activity level, or history of glucocorticoid use, rheumatoid arthritis, cancer or malignancy (all P-interaction ≥ 0.05), with the exception of race for FN BMD (P-interaction = 0.0298). Although slight heterogeneity was observed in the race subgroups for FN BMD, the point estimates consistently demonstrated significant positive associations, with no evidence of trend reversal [Supplementary Tables 3-5 and Figures 3-5].
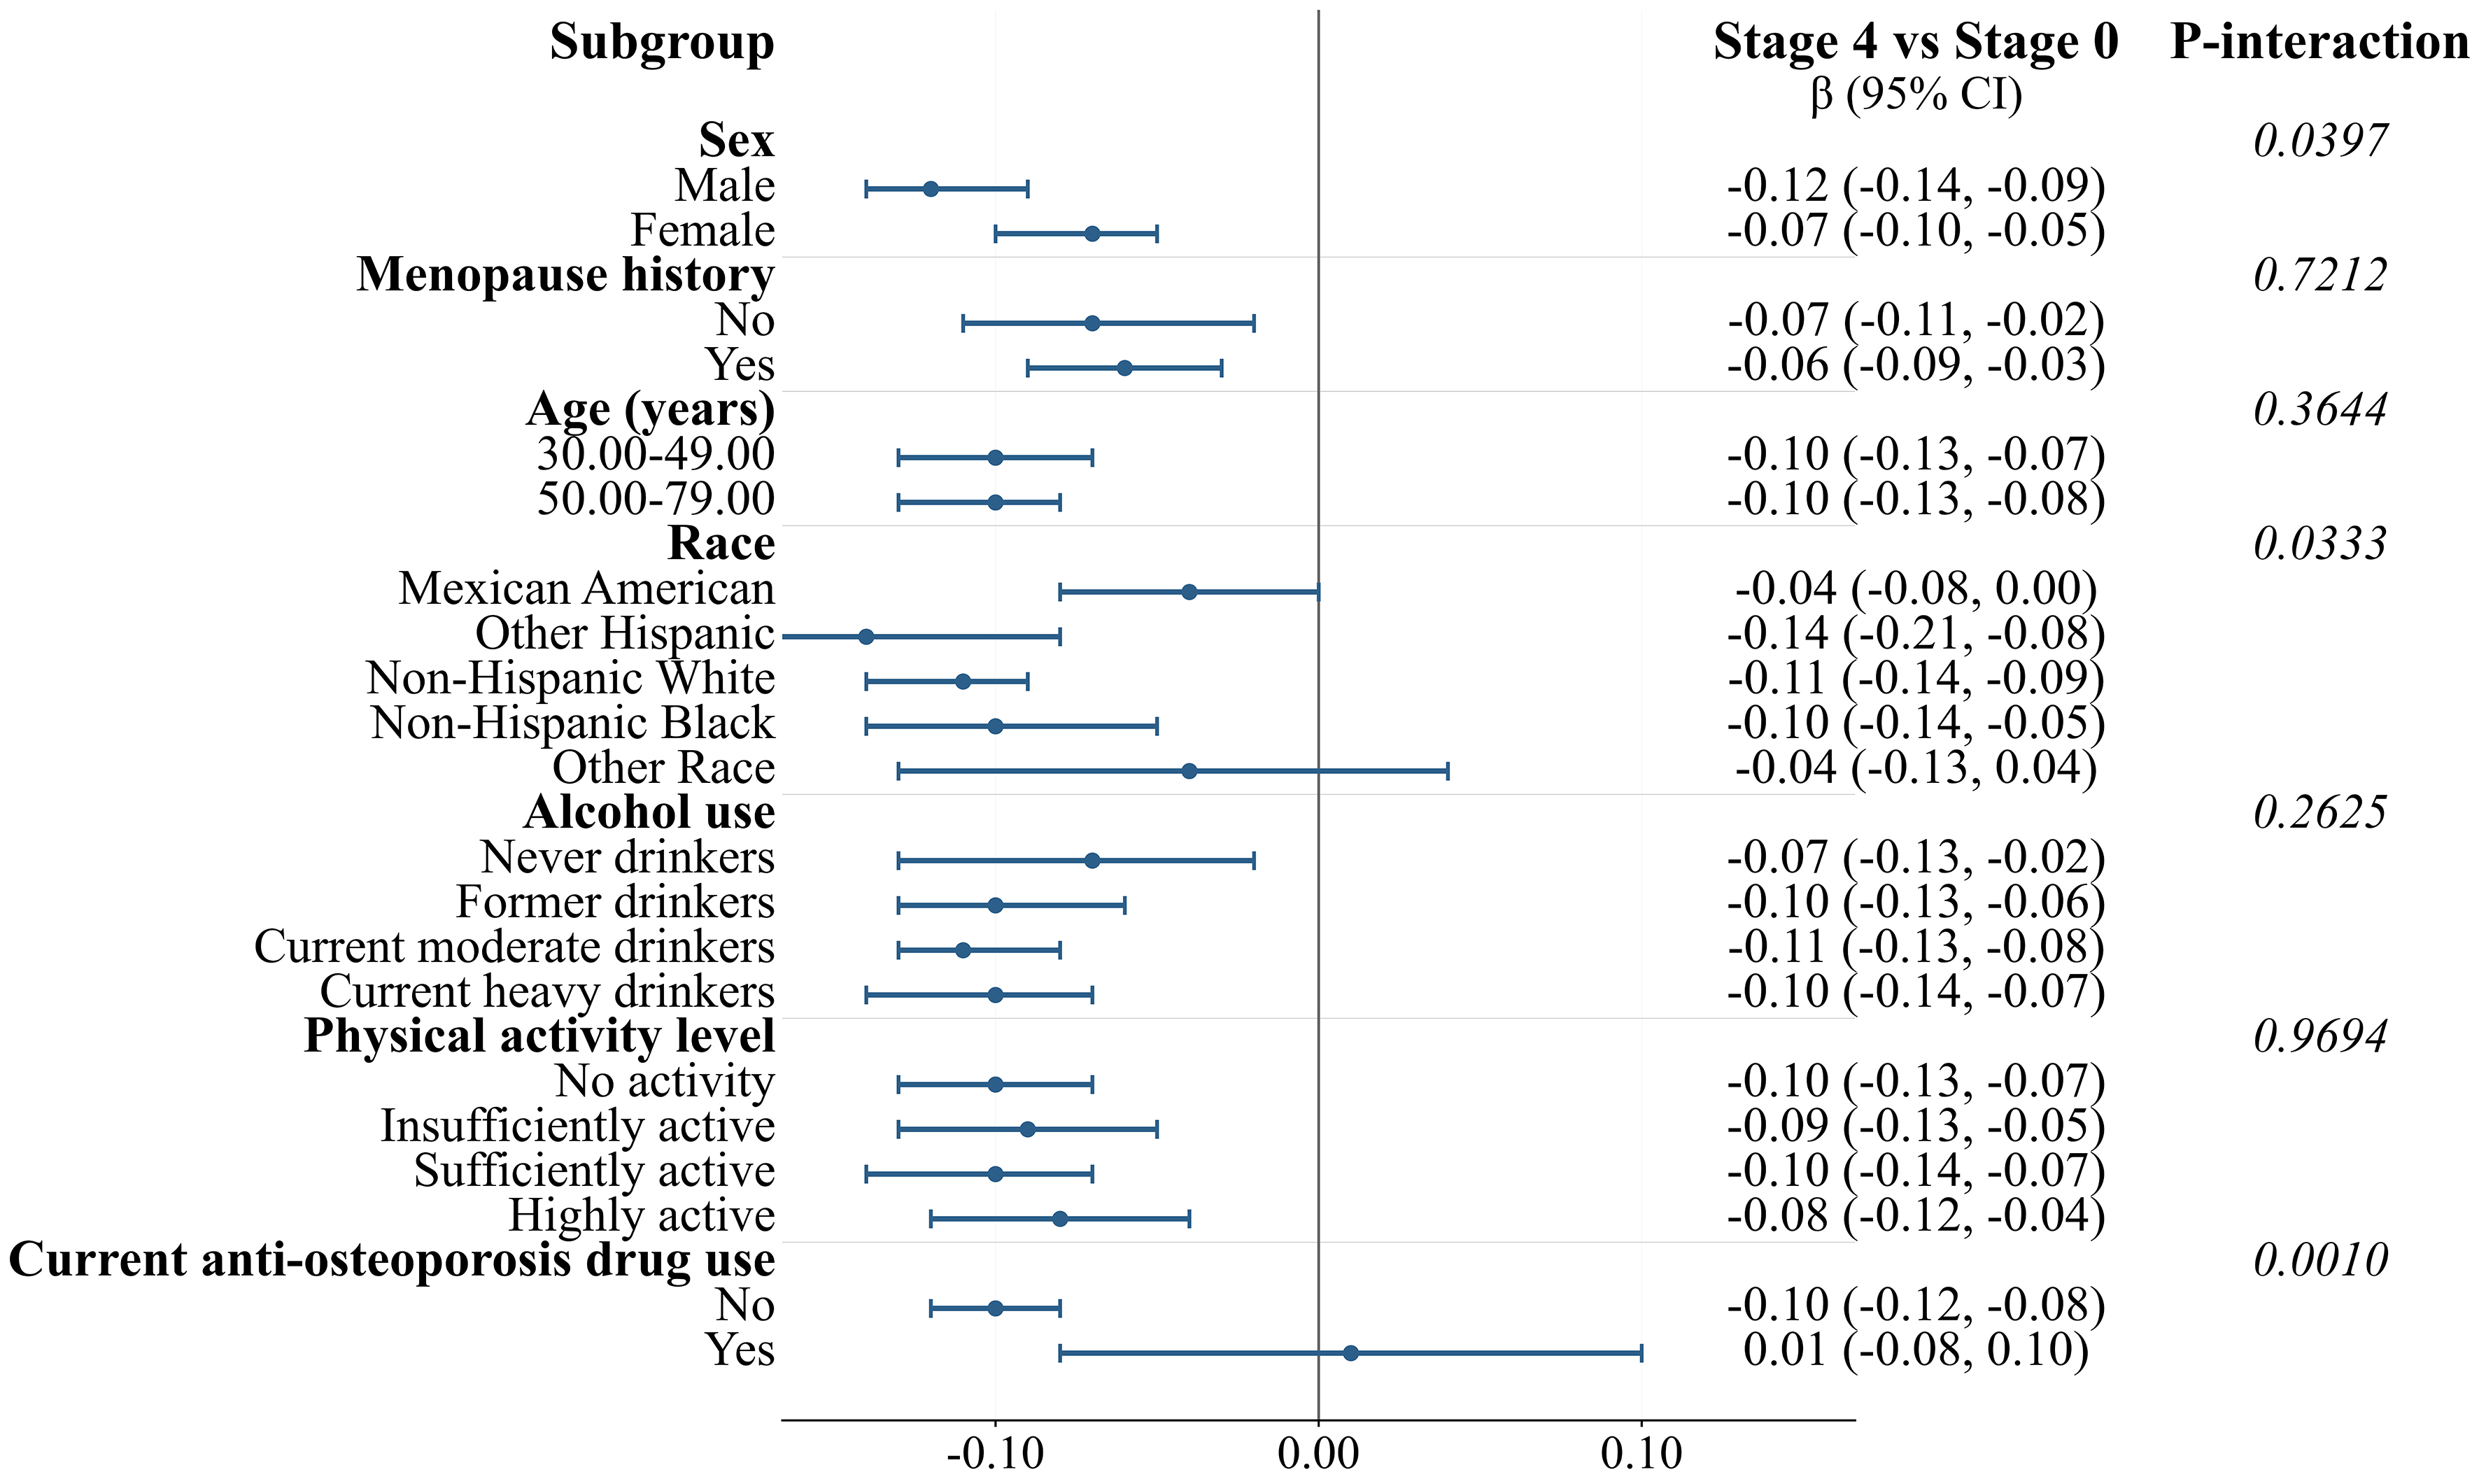
Figure 3. Subgroup analysis of the difference in TBS between CKM syndrome stage 4 and stage 0. TBS: Trabecular bone score; CKM: cardiovascular-kidney-metabolic.

Figure 4. Subgroup analysis of the difference in FN BMD between CKM syndrome stage 4 and stage 0. FN: Femoral neck; BMD: bone mineral density; CKM: cardiovascular-kidney-metabolic.

Figure 5. Subgroup analysis of the difference in LS BMD between CKM syndrome stage 4 and stage 0. LS: Lumbar spine; BMD: bone mineral density; CKM: cardiovascular-kidney-metabolic.
DISCUSSION
In this cross-sectional analysis of 4,364 United States adults aged 30-79 years from NHANES 2005-2008 cycles, advancing CKM syndrome stages exhibited a paradoxical dissociation, in which FN BMD and LS BMD coexisted with an overall lower TBS. This dissociation, similar to the well-established bone paradox in diabetes, underscores the fact that the use of BMD alone is insufficient for fracture risk assessment in this population. Importantly, these findings highlight the unique and innovative clinical value of the TBS. Unlike conventional areal BMD, which only quantifies bone mineral mass and is easily confounded by mechanical loading from obesity or artifactual elevations from vascular calcifications prevalent in CKM syndrome, TBS provides a texture-based index that directly reflects trabecular microarchitecture. By capturing this underlying structural degradation that BMD completely fails to detect, TBS serves as a pivotal tool to unmask the “bone paradox” in patients with CKM syndrome and evaluate their true fracture risk.
In this study, after adjustment for sex, age, race, and multiple covariates, the TBS remained negatively correlated with CKM syndrome stage, whereas BMD showed a positive correlation. The absolute difference in TBS between CKM stage 0 and stage 4 was -0.07; a difference that holds substantial clinical relevance. Based on established consensus[3], one standard deviation (SD) for the TBS in the general population is approximately 0.10. Consequently, the observed difference of -0.07 represents a substantial effect size of approximately 0.7 SD. Given that each 1 SD decrement in the TBS is associated with a 30% to 40% independent increase in the risk of major osteoporotic fractures[3], this effect size translates to a biologically meaningful elevation in relative fracture risk. This quantitative translation underscores the clinical necessity of microarchitectural assessment in individuals with advanced CKM syndrome, particularly when areal BMD is artifactually preserved.
These results align with previous findings. Studies have reported a similar dissociation between TBS and BMD in type 2 diabetes mellitus (T2DM)[13-16], wherein patients typically exhibit normal or elevated BMD along with lower TBS. Advanced CKM syndrome stages frequently coincide with insulin resistance or overt T2DM, indicating that shared metabolic pathways underlie this pattern. In a Chinese cohort, Wu et al. demonstrated that patients with CKD and a lower TBS had an increased fracture risk[17]. Similarly,
The pathophysiological mechanisms of CKM syndrome include insulin resistance, oxidative stress, chronic inflammation, and activation of the renin-angiotensin-aldosterone system, causing multiorgan injury[24]. Our observation of a progressive decline in TBS alongside advancing CKM stages reflects a deterioration in trabecular microarchitecture that is intricately linked to CKM-specific pathophysiology beyond generic inflammation. The progressive decline in TBS with advancing CKM stages may be attributable to a progressive increase in inflammatory markers[25]. Increased cytokine production and systemic inflammation accelerate osteoclastic bone resorption while suppressing osteoblastic activity, thereby increasing bone turnover and disrupting trabecular micro-architecture[26-29]. In addition to inflammation-driven mechanisms, hyperglycaemia directly facilitates the buildup of advanced glycation end-products while concurrently suppressing collagen synthesis[30,31], whereas insulin resistance suppresses Wnt signalling and promotes sclerostin upregulation[30,32]. Similarly, imbalanced insulin-like growth factor 1 signalling further impairs collagen maturation[33], collectively compromising trabecular integrity. Crucially, the CKM syndrome taxonomy inherently integrates CKD severity as a pivotal staging determinant. Advanced CKD (CKM stages 3-4) is associated with compromised bone quality through mechanisms highly specific to CKD-mineral and bone disorder (CKD-MBD). These include calcium-phosphate imbalance and secondary hyperparathyroidism[34], which drive high-turnover bone disease and disrupt trabecular architecture. Furthermore, elevated fibroblast growth factor 23 (FGF23), a hallmark of CKD-MBD, has been shown to negatively correlate with TBS in early-stage CKD, while soluble Klotho, a renoprotective factor that declines with kidney function, positively correlates with TBS[35]. The decline of Klotho and the rise of FGF23 may thus serve as CKM-specific molecular drivers of trabecular deterioration[36]. Additionally, adipokines dysregulated in both metabolic syndrome and CKD (e.g., elevated leptin in CKD, and hypoadiponectinemia in obesity) exert direct effects on bone cells - leptin promotes osteoblast activity while adiponectin has been negatively associated with BMD in certain populations[37,38]. The net effect of this combined metabolic-renal-adipokine dysregulation is a preferential loss of trabecular microarchitecture not fully captured by areal BMD. Notably, segmented regression analysis further revealed that the inverse trend in TBS was predominantly observed across early CKM stages (0-2). This suggests that the critical “window period” for the establishment of trabecular microarchitectural deficits occurs during the early metabolic risk phase (Stages 1-2). In patients with overt organ damage at higher stages (Stages 3-4), the lower TBS values have largely plateaued. This underscores the paramount importance of early bone health screening - specifically integrating TBS assessment at CKM Stage 2 - before severe skeletal fragility is fully established.
Conversely, the observed increase in BMD with advancing CKM syndrome stages may reflect multifactorial mechanisms. Walsh and Vilaca[39] documented a positive correlation between BMI and BMD, mediated by mechanical loading, leptin, and other adipokines, and increased aromatase activity. Furthermore, severe abdominal aortic calcification, which is prevalent in advanced CKD, can artificially elevate anteroposterior lumbar BMD measurements on DXA, potentially obscuring actual skeletal fragility[40]. Additionally, insulin resistance enhances osteoblastic insulin-like growth factor 1 signalling, augmenting bone mass while simultaneously impairing collagen quality[30,41]. Notably, the CKM syndrome taxonomy integrates BMI, CKD severity, and insulin resistance as pivotal staging determinants. This dual effect - preserving BMD through mechanical and endocrine pathways while undermining trabecular quality through CKD-MBD and metabolic dysregulation - provides a CKM-specific biological rationale for the TBS-BMD discordance observed in our study.
The diabetic paradox refers to a paradoxical phenomenon commonly observed in patients with T2DM[42]; despite having normal or even elevated BMD, compared with healthy individuals, their fracture risk is significantly increased. Studies[43,44] have suggested that the increased risk of fractures observed in individuals with T2DM may be linked to a decline in the TBS. In this study, the correlation of the CKM syndrome stage with BMD and the TBS was similar to that observed in patients with T2DM. Specifically, as CKM syndrome progressed, BMD showed an upward trend, whereas the TBS exhibited a downward trend, suggesting that the bone microstructure may have been compromised. The association between the CKM syndrome stage and osteoporosis or previous fractures was not significant, possibly owing to the low incidence of events (which limited statistical power) and the cross-sectional design of the study. In contrast, TBS and BMD, as continuous quantitative measures of bone microarchitecture and mass, are more sensitive to detect subtle stage-related changes than the binary diagnostic threshold for osteoporosis. This discrepancy is not contradictory but rather reflects the differential statistical sensitivity between continuous and categorical outcome measures.
Patients with advanced CKM syndrome usually present with multiple comorbidities and systemic frailty. Hip or vertebral fractures in this population frequently cause prolonged immobility, deep-vein thrombosis, pulmonary infection, and increased mortality[44,45]. Goto et al. reported that patients with CKD experience a greater incidence of falls and fractures, attributable to renal osteodystrophy and associated fall risk factors[46]. Laroche et al. emphasised the increased risk of osteoporosis and subsequent fractures in individuals with CVD[47]. Our observation of significantly reduced TBS levels in advanced CKM syndrome stages, combined with the segmented regression finding that the decline occurs predominantly in early stages, underscores that trabecular microarchitectural damage may already be established by stage 2. Therefore, early intervention, rather than late-stage management, may be critical for preserving bone health. Thus, patients with CKM syndrome should receive early interventions to prevent osteoporosis and fragility fractures. Strategies targeting metabolic risk factors, such as weight management and optimizing insulin sensitivity, may be associated with the preservation of bone microarchitecture. Furthermore, while general pharmacological interventions for osteoporosis are established to modulate bone remodeling[48], their specific structural efficacy, underlying pathways, and clinical outcomes within the CKM syndrome population remain to be fully elucidated through dedicated prospective studies.
Further research involving larger cohorts and prolonged follow-up periods is necessary to confirm the effectiveness of the TBS as a preliminary marker for fracture risk in individuals with CKM syndrome. If confirmed, the TBS could be integrated into CKM syndrome risk-stratification algorithms to disrupt the critical pathological sequence from deteriorating bone quality to fracture events.
Subgroup analyses further revealed that the decline in TBS with advancing CKM syndrome stages was more pronounced in males than in females (interaction P = 0.0397). Notably, effect modification by menopausal status was not significant (P-interaction = 0.7212). However, this finding should be interpreted with caution, as the distribution of menopausal status across CKM stages was highly imbalanced: among the 77 female participants in Stage 3, 71 (92.21%) were postmenopausal, whereas only 6 (7.79%) were premenopausal. This extreme imbalance substantially limits the statistical power to detect a true interaction and may have contributed to the null finding. Future studies with larger sample sizes, particularly in advanced CKM stages, are warranted to more robustly evaluate the potential modifying effect of menopausal status on the CKM-TBS association. Additionally, a significant interaction was observed for anti-osteoporosis medication use (P-interaction = 0.0010), with the inverse association between CKM stage and TBS largely confined to non-users, indicating that pharmacological bone protection may attenuate the deleterious effects of CKM syndrome on trabecular microarchitecture. A significant interaction was also observed for race (P-interaction = 0.0333).
Limitations
Several limitations of this study should be acknowledged. First, the cross-sectional design precludes the establishment of causal relationships between CKM syndrome stage and bone health outcomes. The observed associations should be interpreted as correlational rather than causal, and reverse causation cannot be entirely excluded. Second, the relatively low prevalence of osteoporosis and prior fractures in our study population limited the statistical power to detect significant associations with CKM syndrome stages. Specifically, the inclusion of a substantial proportion of younger adults (median age 51 years) naturally dilutes the incidence of these endpoint events. Furthermore, data regarding prior fractures were predominantly derived from self-reported questionnaires, which inevitably introduces recall and information bias, potentially further masking true clinical associations. Third, the absence of bone turnover markers, such as procollagen type 1 N-terminal propeptide and β-isomerised C-terminal telopeptide of type 1 collagen, restricted our ability to assess the dynamic processes of bone remodelling and to elucidate the underlying mechanisms linking CKM syndrome to compromised bone health. Fourth, the lack of longitudinal CKM trajectory data prevented us from evaluating how changes in CKM stage over time affect bone health, which would be more informative for clinical management. Fifth, the NHANES dataset does not include detailed information on certain potential confounders, such as sun exposure, specific dietary patterns, or family history of osteoporosis, which may have contributed to residual confounding despite our comprehensive adjustments. Sixth, the use of DXA-derived BMD may be influenced by degenerative spinal changes, aortic calcification, and abdominal adiposity, which are more prevalent in advanced CKM stages and may artificially elevate LS BMD measurements. Finally, while we observed a significant interaction between CKM stage and anti-osteoporosis medication use, the small number of medication users in our sample warrants cautious interpretation. Future multicentre prospective cohort studies integrating bone metabolic markers, advanced bone geometry assessment, and longer follow-up are needed to confirm our findings and to elucidate the causal mechanisms underlying the observed paradox.
Conclusion
In conclusion, this study is the first to reveal a paradoxical relationship in bone health associated with CKM syndrome, where advanced stages are associated with progressive decline in the TBS despite increases in the FN BMD and LS BMD. This dissociation, similar to the well-established bone paradox in T2DM, underscores that relying solely on BMD is insufficient for assessing fracture risk in this population. A comprehensive evaluation should incorporate the TBS to capture the full spectrum of bone fragility. For patients with early-stage CKM, particularly those with high fracture risk, we recommend concurrent TBS assessment during routine BMD testing to enable early detection of microarchitectural bone deficits and refine fracture risk stratification. Longitudinal studies are required to establish causality and inform personalised bone-health interventions for patients with CKM syndrome. Additional research is necessary to explore the pathophysiological mechanisms that contribute to these associations.
DECLARATIONS
Acknowledgments
This research is founded upon data obtained from the NHANES. We extend our gratitude to the NHANES research personnel and all participants for their invaluable contributions and commitment to the NHANES initiative.
Authors’ contributions
Contributed to the study conception and design: Lin J, Chen W, Hong X, Cai Z, Peng H, Feng D, Chen L (Liyu Chen), Li H, Chen L (Ling Chen)
Study conception and design: Lin J, Chen L (Ling Chen)
Performed statistical analyses and prepared the initial draft: Lin J, Chen L (Ling Chen), Chen W, Hong X, Cai Z
Acquired the data: Lin J, Cai Z, Peng H
Curated and interpreted the data: Feng D, Chen L (Liyu Chen)
Critically revised the manuscript for intellectual content: Li H, Chen L (Ling Chen)
All authors read and approved the final manuscript.
Availability of data and materials
All data analysed during the current study are available in the NHANES open repository, https://wwwn.cdc.gov/nchs/nhanes/Default.aspx.
AI and AI-assisted tools statement
During the preparation of this manuscript, the AI tool DeepSeek-R1 (online web-based version, released 2025-01-20) was used solely for language translation and preliminary grammar checking to facilitate the writing process. The tool did not influence the study design, data collection, analysis, interpretation, or the scientific content of the work. All authors take full responsibility for the accuracy, integrity, and final content of the manuscript.
Financial support and sponsorship
This study was funded by the National Science Foundation of China (grant number: 82200987), Shenzhen Science and Technology Program (grant number: JCYJ20220530150607017), Research Funding for Postdoctoral Fellows to Work in Shenzhen, Shenzhen Clinical Research Center for Metabolic Diseases (grant number: LCYSSQ20210621092535005), Shenzhen Center for Diabetes Control and Prevention [grant number: SZMHC(2020)46], Sanming Project of Medicine in Shenzhen Municipality (grant number: SZSM202211026), Noncommunicable Chronic Diseases-National Science and Technology Major Project (grant numbers: 2023ZD0508200 and 2023ZD0508205).
Conflicts of interest
All authors declared that there are no conflicts of interest.
Ethical approval and consent to participate
The NHANES protocols were approved by the National Center for Health Statistics Research Ethics Review Board, and written informed consent was obtained from all participants. As this study was a secondary analysis of publicly available, de-identified NHANES data, additional ethics approval and informed consent were not required.
Consent for publication
Not applicable.
Copyright
© The Author(s) 2026.
Supplementary Materials
REFERENCES
2. Zhang X, Xu H, Li GH, et al. Metabolomics insights into osteoporosis through association with bone mineral density. J Bone Miner Res. 2021;36:729-38.
3. Shevroja E, Reginster JY, Lamy O, et al. Update on the clinical use of trabecular bone score (TBS) in the management of osteoporosis: results of an expert group meeting organized by the European Society for Clinical and Economic Aspects of Osteoporosis, Osteoarthritis and Musculoskeletal Diseases (ESCEO), and the International Osteoporosis Foundation (IOF) under the auspices of WHO Collaborating Center for Epidemiology of Musculoskeletal Health and Aging. Osteoporos Int. 2023;34:1501-29.
4. Ndumele CE, Neeland IJ, Tuttle KR, et al. ; American Heart Association. A synopsis of the evidence for the science and clinical management of cardiovascular-kidney-metabolic (CKM) syndrome: a scientific statement from the american heart association. Circulation. 2023;148:1636-64.
5. Ndumele CE, Rangaswami J, Chow SL, et al. Cardiovascular-kidney-metabolic health: a presidential advisory from the American Heart Association. Circulation. 2023;148:1606-35.
6. Ye S, Shi L, Zhang Z. Effect of insulin resistance on gonadotropin and bone mineral density in nondiabetic postmenopausal women. Front Endocrinol. 2023;14:1235102.
7. Rodríguez-Gómez I, Gray SR, Ho FK, et al. Osteoporosis and its association with cardiovascular disease, respiratory disease, and cancer: findings from the UK Biobank prospective cohort study. Mayo Clin Proc. 2022;97:110-21.
8. Miller PD, Adachi JD, Albergaria BH, et al. Efficacy and safety of romosozumab among postmenopausal women with osteoporosis and mild-to-moderate chronic kidney disease. J Bone Miner Res. 2022;37:1437-45.
9. Zhang Y, Tan C, Tan W. BMI, socioeconomic status, and bone mineral density in U.S. adults: mediation analysis in the NHANES. Front Nutr. 2023;10:1132234.
10. Greere D, Grigorescu F, Manda D, et al. Relative contribution of metabolic syndrome components in relation to obesity and insulin resistance in postmenopausal osteoporosis. J Clin Med. 2024;13:2529.
11. Kidney Disease: Improving Global Outcomes (KDIGO) CKD Work Group. KDIGO 2024 Clinical Practice Guideline for the Evaluation and Management of Chronic Kidney Disease. Kidney Int. 2024;105:S117-314.
12. Inker LA, Eneanya ND, Coresh J, et al. ; Chronic Kidney Disease Epidemiology Collaboration. New creatinine- and cystatin C-based equations to estimate GFR without race. N Engl J Med. 2021;385:1737-49.
13. Delbari N, Rajaei A, Oroei M, Ahmadzadeh A, Farsad F. A comparison between femoral neck and LS-BMD with LS-TBS in T2DM patients: a case control study. BMC Musculoskelet Disord. 2021;22:582.
14. Leslie WD, Binkley N, Schousboe JT, Silva BC, Hans D. Effect of abdominal tissue thickness on trabecular bone score and fracture risk in adults with diabetes: the Manitoba BMD registry. J Bone Miner Res. 2024;39:877-84.
15. Fazullina ON, Korbut AI, Klimontov VV. Factors associated with trabecular bone score in postmenopausal women with type 2 diabetes and normal bone mineral density. World J Diabetes. 2022;13:553-65.
16. Vigevano F, Gregori G, Colleluori G, et al. In men with obesity, T2DM is associated with poor trabecular microarchitecture and bone strength and low bone turnover. J Clin Endocrinol Metab. 2021;106:1362-76.
17. Wu B, Wu H, Wang Z, et al. Assessment of bone health in pre-dialysis CKD patients based on TBS reference range for the Chinese population. Front Med. 2025;12:1556782.
18. Aleksova J, Kurniawan S, Elder GJ. The trabecular bone score is associated with bone mineral density, markers of bone turnover and prevalent fracture in patients with end stage kidney disease. Osteoporos Int. 2018;29:1447-55.
19. Aleksova J, Kurniawan S, Vucak-Dzumhur M, et al. Aortic vascular calcification is inversely associated with the trabecular bone score in patients receiving dialysis. Bone. 2018;113:118-23.
20. Ciceri P, Cozzolino M. The emerging role of iron in heart failure and vascular calcification in CKD. Clin Kidney J. 2021;14:739-45.
21. Huang JF, Zheng XQ, Sun XL, et al. Association between bone mineral density and severity of chronic kidney disease. Int J Endocrinol. 2020;2020:8852690.
22. Tang H, He JH, Gu HB, et al. The different correlations between obesity and osteoporosis after adjustment of static mechanical loading from weight and fat free mass. J Musculoskelet Neuronal Interact. 2021;21:351-7.
23. Sheu A, Blank RD, Tran T, et al. Associations of type 2 diabetes, body composition, and insulin resistance with bone parameters: the dubbo osteoporosis epidemiology study. JBMR Plus. 2023;7:e10780.
24. Massy ZA, Drueke TB. Combination of cardiovascular, kidney, and metabolic diseases in a syndrome named cardiovascular-kidney-metabolic, with new risk prediction equations. Kidney Int Rep. 2024;9:2608-18.
25. Gao C, Gao S, Zhao R, et al. Association between systemic immune-inflammation index and cardiovascular-kidney-metabolic syndrome. Sci Rep. 2024;14:19151.
26. Yu B, Wang CY. Osteoporosis and periodontal diseases - an update on their association and mechanistic links. Periodontol 2000. 2022;89:99-113.
27. Forte YS, Renovato-Martins M, Barja-Fidalgo C. Cellular and molecular mechanisms associating obesity to bone loss. Cells. 2023;12:521.
28. Tang Y, Peng B, Liu J, Liu Z, Xia Y, Geng B. Systemic immune-inflammation index and bone mineral density in postmenopausal women: a cross-sectional study of the national health and nutrition examination survey (NHANES) 2007-2018. Front Immunol. 2022;13:975400.
29. Tao H, Li W, Zhang W, et al. Urolithin A suppresses RANKL-induced osteoclastogenesis and postmenopausal osteoporosis by, suppresses inflammation and downstream NF-κB activated pyroptosis pathways. Pharmacol Res. 2021;174:105967.
30. Moreira CA, Barreto FC, Dempster DW. New insights on diabetes and bone metabolism. J Bras Nefrol. 2015;37:490-5.
31. Sheng N, Xing F, Wang J, et al. Recent progress in bone-repair strategies in diabetic conditions. Mater Today Bio. 2023;23:100835.
32. Wong SK, Mohamad NV, Jayusman PA, Ibrahim N’. A review on the crosstalk between insulin and Wnt/β-catenin signalling for bone health. Int J Mol Sci. 2023;24:12441.
33. Yuan Y, Duan R, Wu B, et al. Gene expression profiles and bioinformatics analysis of insulin-like growth factor-1 promotion of osteogenic differentiation. Mol Genet Genomic Med. 2019;7:e00921.
34. Malluche HH, Porter DS, Pienkowski D. Evaluating bone quality in patients with chronic kidney disease. Nat Rev Nephrol. 2013;9:671-80.
35. Kužmová Z, Kužma M, Gažová A, et al. Fibroblast growth factor 23 and klotho are associated with trabecular bone score but not bone mineral density in the early stages of chronic kidney disease: results of the cross-sectional study. Physiol Res. 2021;70:S43-51.
36. Fan Z, Wei X, Zhu X, et al. Correlation between soluble klotho and chronic kidney disease-mineral and bone disorder in chronic kidney disease: a meta-analysis. Sci Rep. 2024;14:4477.
37. Liu Y, Song CY, Wu SS, Liang QH, Yuan LQ, Liao EY. Novel adipokines and bone metabolism. Int J Endocrinol. 2013;2013:895045.
38. Deepika F, Bathina S, Armamento-Villareal R. Novel adipokines and their role in bone metabolism: a narrative review. Biomedicines. 2023;11:644.
39. Walsh JS, Vilaca T. Obesity, type 2 diabetes and bone in adults. Calcif Tissue Int. 2017;100:528-35.
40. Campagnaro LS, Carvalho AB, Pina PM, Watanabe R, Canziani MEF. Bone mass measurement by DXA should be interpreted with caution in the CKD population with vascular calcification. Bone Rep. 2022;16:101169.
41. Mazziotti G, Lania AG, Canalis E. Skeletal disorders associated with the growth hormone-insulin-like growth factor 1 axis. Nat Rev Endocrinol. 2022;18:353-65.
42. Wang J, Cui W. Decoding the diabetic bone paradox: how AGEs sabotage skeletal integrity. Cell Rep Med. 2024;5:101693.
43. Ubago-Guisado E, Moratalla-Aranda E, González-Salvatierra S, et al. Do patients with type 2 diabetes have impaired hip bone microstructure? A study using 3D modeling of hip dual-energy X-ray absorptiometry. Front Endocrinol. 2022;13:1069224.
44. Paul J, Devarapalli V, Johnson JT, et al. Do proximal hip geometry, trabecular microarchitecture, and prevalent vertebral fractures differ in postmenopausal women with type 2 diabetes mellitus? A cross-sectional study from a teaching hospital in southern India. Osteoporos Int. 2021;32:1585-93.
45. Sheehan KJ, Sobolev B, Chudyk A, Stephens T, Guy P. Patient and system factors of mortality after hip fracture: a scoping review. BMC Musculoskelet Disord. 2016;17:166.
46. Goto NA, Weststrate ACG, Oosterlaan FM, et al. The association between chronic kidney disease, falls, and fractures: a systematic review and meta-analysis. Osteoporos Int. 2020;31:13-29.
47. Laroche M, Pécourneau V, Blain H, et al. ; GRIO scientific committee. Osteoporosis and ischemic cardiovascular disease. Joint Bone Spine. 2017;84:427-32.
Cite This Article
 Open Access
How to Cite
Download Citation
Export Citation File:
Type of Import
Tips on Downloading Citation
Citation Manager File Format
Type of Import
Direct Import: When the Direct Import option is selected (the default state), a dialogue box will give you the option to Save or Open the downloaded citation data. Choosing Open will either launch your citation manager or give you a choice of applications with which to use the metadata. The Save option saves the file locally for later use.
Indirect Import: When the Indirect Import option is selected, the metadata is displayed and may be copied and pasted as needed.
About This Article
Special Topic
Copyright

Data & Comments
Data
0










Comments
Comments must be written in English. Spam, offensive content, impersonation, and private information will not be permitted. If any comment is reported and identified as inappropriate content by OAE staff, the comment will be removed without notice. If you have any queries or need any help, please contact us at support@oaepublish.com.