


Estimated pulse wave velocity and cognitive decline over time in ageing adults
 0
0 
Abstract
Aim: Estimated pulse wave velocity (ePWV) is a validated measure of arterial stiffness. While linked to cardiovascular disease, its longitudinal relationship with domain-specific cognitive decline in the general ageing population remains to be fully established.
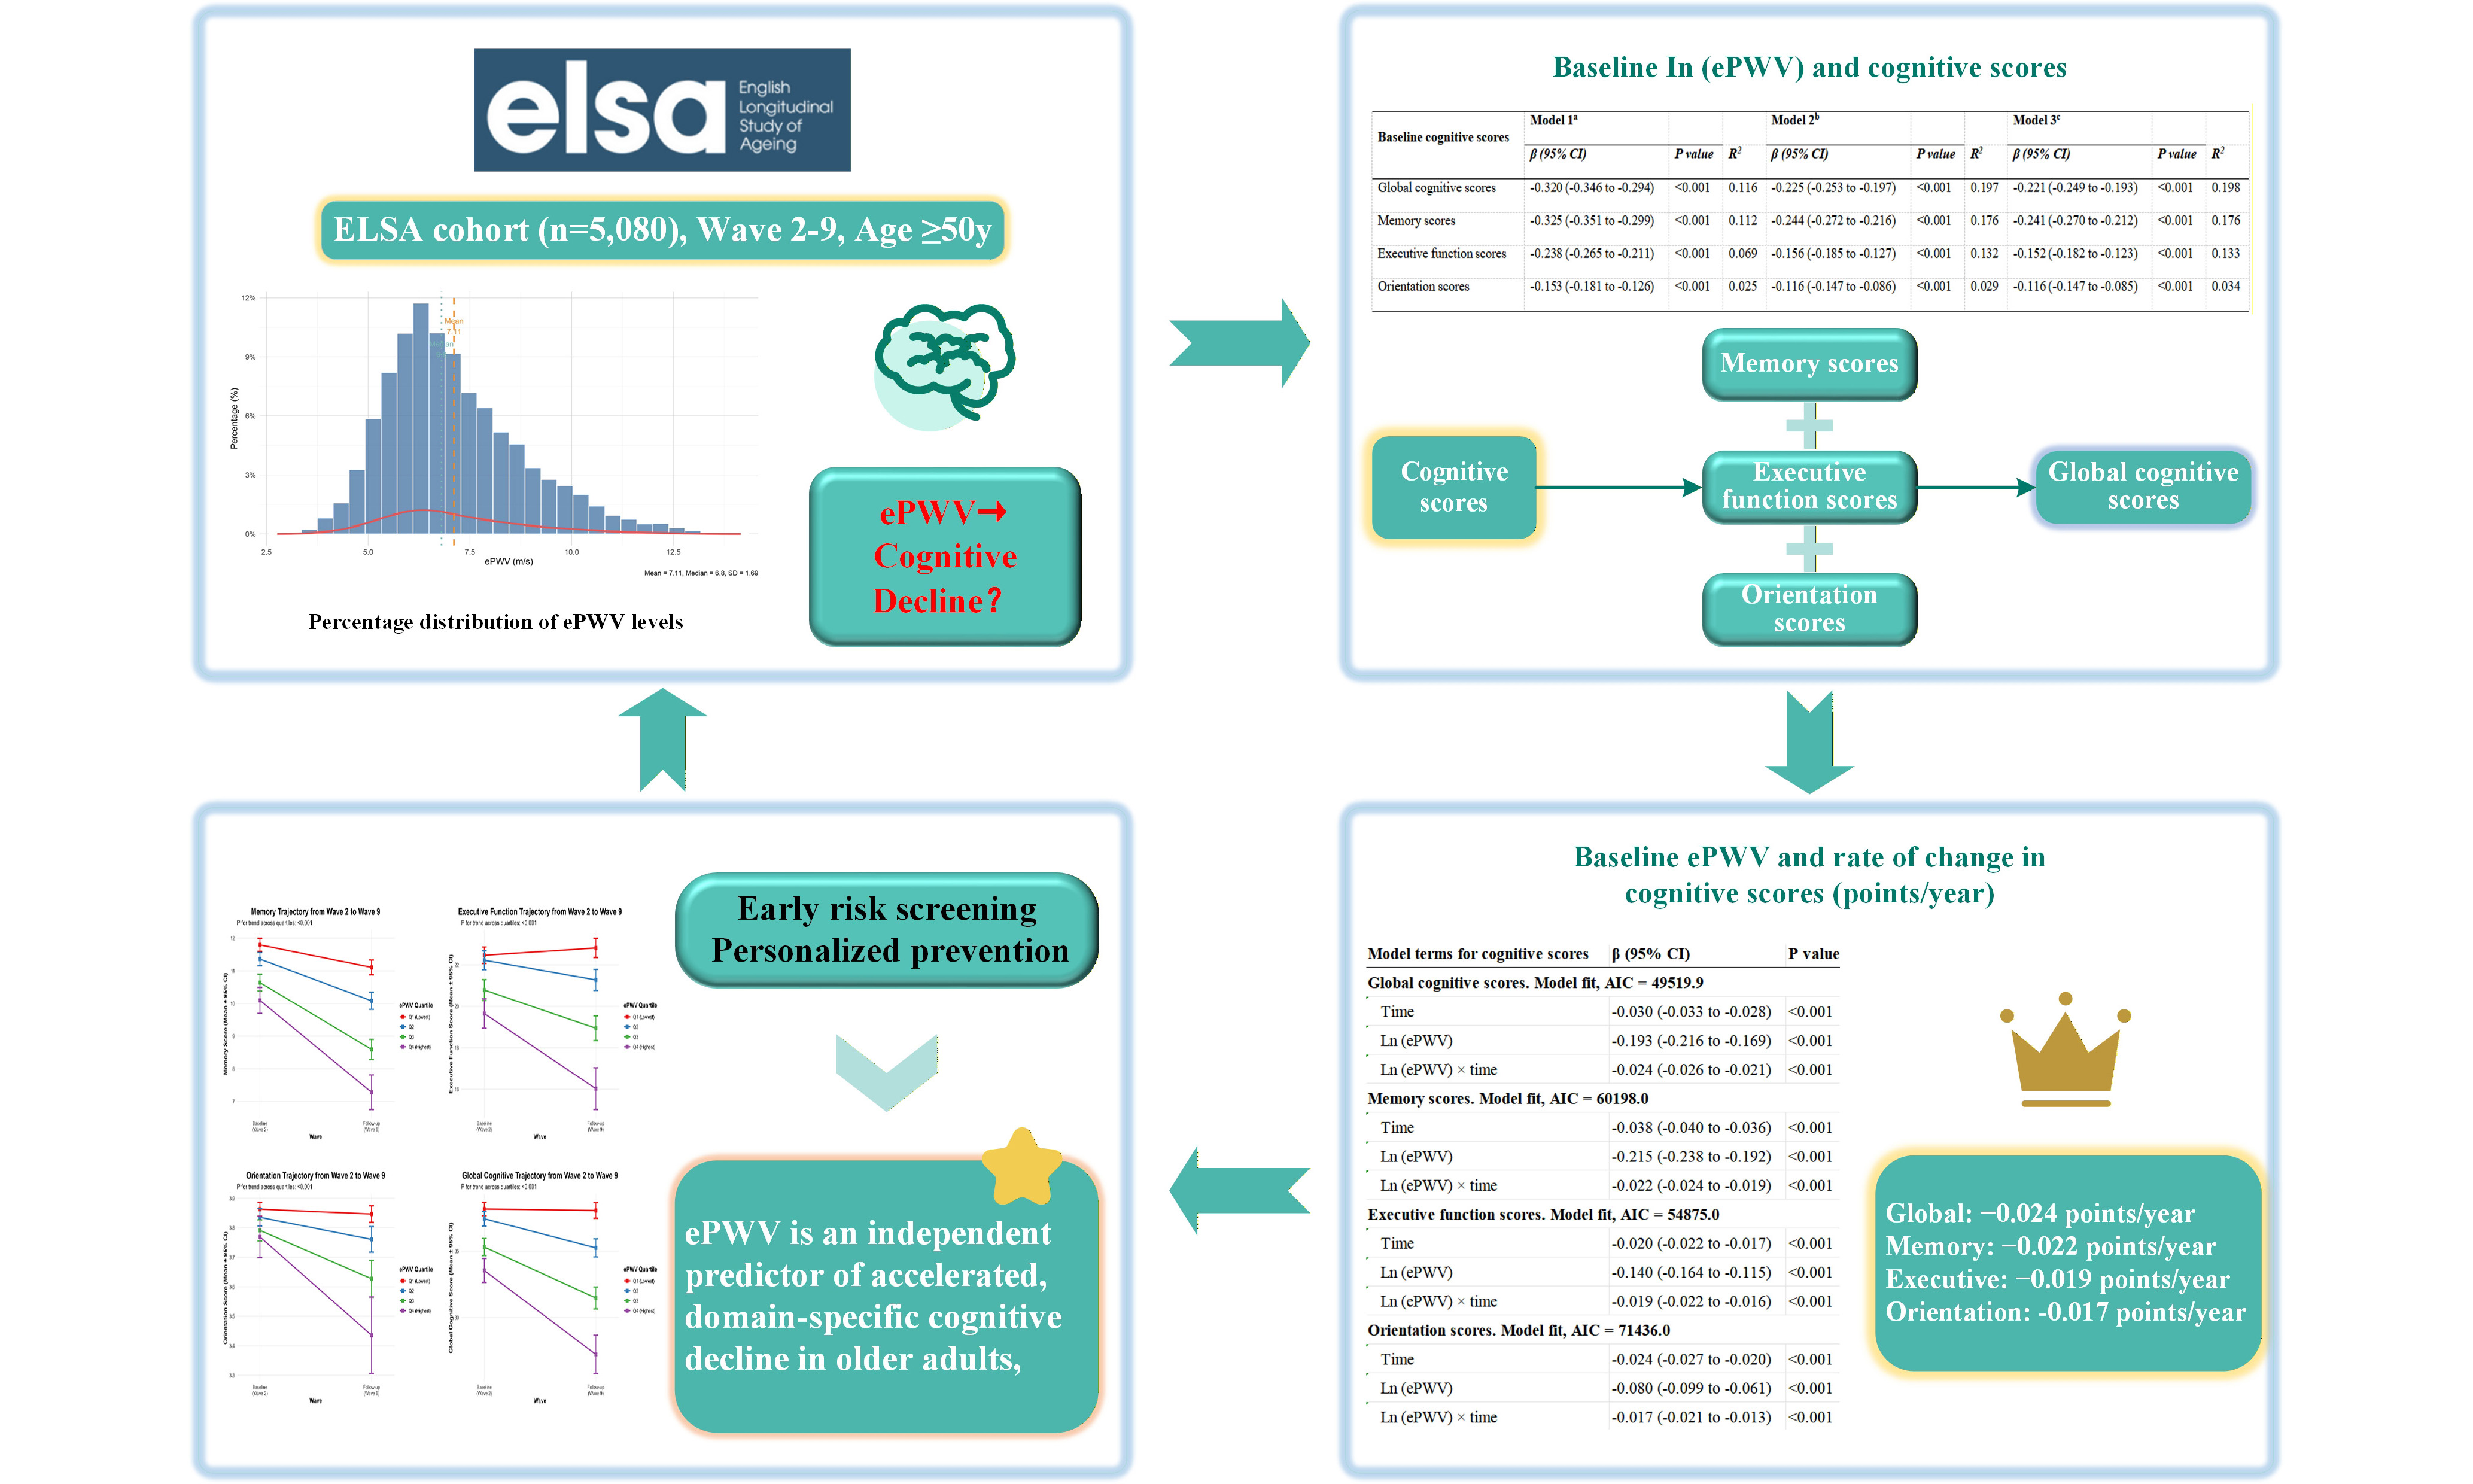
Methods: We studied 5,080 participants (median age 64.0 years) from the English Longitudinal Study of Ageing (waves 2-9, 2004-2019). Baseline ePWV was calculated from age and mean blood pressure. Cognitive function (global, memory, executive, orientation) was assessed biennially. We used multivariable-adjusted linear mixed models to examine associations between baseline ePWV (natural log-transformed) and the rate of cognitive decline across a median follow-up duration of 10.1 years.
Results: In cross-sectional analysis, higher baseline ePWV was linked to poorer cognitive scores across all domains (all P < 0.001). Longitudinally, each unit increase in log-ePWV was linked to an accelerated annual decline in global cognitive score (-0.024 points/year; 95% confidence interval (CI) -0.026 to -0.021), memory (-0.022; -0.024 to 0.019), executive function (-0.019; -0.022 to -0.016), and orientation (-0.017; -0.021 to -0.013). A distinct dose-response pattern was evident: compared to the lowest quartile, participants in the highest ePWV quartile experienced the fastest decline in global cognition (-0.128 points/year), memory (-0.118/year), and executive function (-0.102/year) (P for trend < 0.001).
Conclusion: Higher arterial stiffness, as measured by ePWV, is independently linked to accelerated long-term decline across diverse cognitive domains in community-dwelling older adults. ePWV may be a useful vascular biomarker linked to increased cognitive decline risk, requiring confirmation in prospective studies.
Keywords
INTRODUCTION
Arterial stiffness is a recognized indicator of vascular aging and has gained recognition as an early, modifiable risk factor for cardiovascular diseases and mortality in the elderly[1]. Pulse wave velocity (PWV), particularly carotid-femoral PWV (cfPWV), is considered as the most reliable non-invasive method for evaluating arterial stiffness and is strongly predictive of adverse vascular outcomes[2]. In recent years, an estimated pulse wave velocity (ePWV) has been developed and validated as a practical alternative to carotid-femoral pulse wave velocity (cfPWV). This estimation is derived from easily accessible clinical parameters, including age and blood pressure, making it particularly suitable for large-scale epidemiological studies[3,4]. This study employs ePWV given its strong validation against cfPWV, feasibility in large cohorts where direct measurement is impractical, its established prognostic value for clinical outcomes, and its potential as a scalable clinical biomarker. ePWV demonstrates a strong correlation with the measured cfPWV and is further linked to elevated risks of cardiovascular events and all-cause mortality[5]. In addition to its established impact on cardiovascular health, arterial stiffness is increasingly recognized as a potential contributor to cognitive decline and dementia. This perspective aligns with a growing understanding of the vascular factors involved in neurodegenerative processes[6,7]. This vascular-cognitive link is especially relevant in aging societies, where the burden of cognitive impairment is rising and modifiable risk factors are urgently sought for prevention.
Although numerous studies have explored the connection between traditional vascular risk factors - such as hypertension, diabetes, and dyslipidemia - and cognitive dysfunction, the independent role of arterial stiffness has only recently come into focus[8,9]. Mechanistically, elevated arterial stiffness results in diminished damping of pulsatile flow, thereby subjecting the cerebral microcirculation to heightened pressure and flow fluctuations. This can result in microvascular damage, white matter hyperintensities, reduced cerebral perfusion, and ultimately structural brain changes that underlie cognitive decline[10]. Current findings from cross-sectional and short-term longitudinal research indicate that PWV may be linked to reduced performance in memory and executive function[11]. However, these studies have notable limitations: many rely on single-timepoint cognitive measures, limited sample sizes, or do not account for key confounders such as depressive symptoms, inflammation, or comorbidities[12,13]. More importantly, few studies have leveraged the ePWV metric specifically in long-term follow-up cohorts to assess domain-specific cognitive trajectories[9]. As a result, it remains unclear whether higher ePWV can independently predict cognitive decline over extended periods in community-dwelling older adults.
To fill this gap, this study examined the longitudinal link between baseline ePWV and 14-year cognitive decline using data from the English Longitudinal Study of Ageing (ELSA), a nationally representative cohort of adults aged 50+ in England. By utilizing repeated, standardized cognitive assessments across memory, orientation, and executive function domains, and a validated equation to compute ePWV from age and mean blood pressure (MBP), our analysis offers a robust framework to examine the potential of ePWV as a non-invasive vascular biomarker for cognitive aging. Furthermore, we comprehensively adjust for a wide array of sociodemographic, behavioral, and clinical covariates to isolate the independent effect of ePWV. By employing this methodology, we seek to enhance comprehension of the role of vascular factors in cognitive decline and to assess the clinical applicability of ePWV for the early detection of individuals at increased risk of cognitive impairment. This approach provides valuable perspectives for developing preventive measures in aging populations.
METHODS
Study subjects
This study employed data from Wave 2 (2004-2005) to Wave 9 (2018-2019) of the ELSA, a nationally representative, prospective cohort study designed to investigate the health, economic, social, and psychological conditions of individuals aged 50 years and above living in England. ELSA adopts a stratified probability sampling approach to guarantee the representativeness of the English population within this specific age cohort. Comprehensive data on participants are gathered biennially through a combination of in-person interviews, nurse-administered assessments, and self-administered questionnaires. The study’s multidisciplinary approach allows for comprehensive assessment of ageing-related changes, including cognitive performance, cardiovascular health, and biochemical markers[14]. For the present analysis, we included participants from Wave 2 (2004-2005) through Wave 9 (2018-2019) who had complete data on ePWV and cognitive assessments. Of the 9,432 participants interviewed at Wave 2, we excluded those who did not undergo nurse visits (n = 1,766), those who missed baseline ePWV results (n = 104), those who reported a diagnosis of dementia or Alzheimer’s disease at baseline (n = 42), those who did not complete all baseline cognitive tests (n = 23), and those who missed laboratory results (n = 1,838). Additionally, we excluded 579 individuals lost to follow-up across Waves 3-9. The final analytical sample comprised 5,080 participants (2,280 men and 2,800 women) with valid baseline ePWV measurements and at least one follow-up cognitive assessment [Supplementary Figure 1]. The ELSA investigation received ethical approval from the London Multicentre Research Ethics Committee (reference MREC/01/2/91), and written informed consent was secured from every participant.
Definition of ePWV
ePWV was determined using a validated equation that incorporates age and MBP, as described in previous methodological and clinical studies[4]. The calculation was performed using the following formula: ePWV = 9.587 - 0.402 * age + 4.560 * 10-3 * age2 - 2.621 * 10-5 * age2 * MBP + 3.176 * 10-3 * age * MBP - 1.832 * 10-2 * MBP, where ePWV is expressed in meters per second (m/s), age in years, and MBP in mmHg. MBP is calculated as: MBP = diastolic blood pressure + 0.4 × (systolic blood pressure - diastolic blood pressure), with both systolic and diastolic blood pressures (SBP and DBP) measured in mmHg. This equation, developed by Greve et al. and validated against directly measured cfPWV, was selected because it is the most widely used ePWV formula in large epidemiological studies, has demonstrated strong predictive value for cardiovascular outcomes, and enables direct comparability with prior research on ePWV and cognitive aging[3,4]. In the present study, SBP and DBP measurements were obtained during the nurse visit at wave 2. Following a standardized protocol, three consecutive readings were taken from the seated participant’s right arm using an Omron HEM-907 digital monitor, and the mean of the second and third measurements was employed to derive systolic and diastolic values for the computation of MBP and subsequent ePWV.
Cognitive assessments
Cognitive function was evaluated at baseline (wave 2) and at each subsequent two-year follow-up interval (waves 3-9). The assessment protocol comprised established tasks designed to measure multiple cognitive domains. All cognitive evaluations were conducted by trained interviewers following standardized protocols to ensure consistency across different survey waves. The repeated, multi-domain design allows for the examination of both cross-sectional cognitive performance and longitudinal trajectories of decline: (1) Memory performance was evaluated through a 10-word recall task. In this task, individuals were provided with a list of 10 unrelated words and instructed to recall them immediately (immediate recall), followed by a second recall attempt after a brief interval occupied by non-memory activities (delayed recall). Each recall trial was evaluated on a scale from 0 to 10. A composite memory score, ranging from 0 to 20, was calculated by adding the scores from both the immediate and delayed recall trials. Higher scores on this composite measure reflect superior performance in verbal episodic memory. The theoretical range is 0 to 20, where each point corresponds to one correctly recalled word. A 1-point decline represents a reduction in immediate or delayed verbal recall by one word, which is considered clinically meaningful in ageing populations. This task has demonstrated good reliability and validity in ageing populations and is sensitive to age-related cognitive decline[15]; (2) Executive function was assessed using a semantic verbal fluency task. Participants were instructed to generate as many distinct animal names as possible within a 60-s timeframe. The final score was determined by the total count of correct and unique animal names produced. The score range is theoretically unbounded, but in practice, scores typically fall between 0 and 40 in this cohort. A decline of 2-3 points is often regarded as a clinically noticeable change in verbal fluency and cognitive flexibility. This task engages cognitive processes such as strategic retrieval, cognitive flexibility, and processing speed, and has been extensively employed as a reliable measure of executive function in large-scale aging research[16]; (3) Orientation was assessed using four items that inquired about the present date, specifically the day of the month, month, year, and day of the week. Each item was scored as correct (1 point) or incorrect (0 points), resulting in an orientation score with a possible range from 0 to 4[17]. A score of 4 indicates full orientation; scores ≤ 3 suggest possible temporal disorientation, which is often associated with mild cognitive impairment or early dementia; (4) A comprehensive global cognitive score was derived by aggregating the standardized scores from assessments of memory, executive function, and orientation. This composite measure has a mean of 0 and a standard deviation of 1 at baseline. Positive scores indicate above-average performance, while negative scores indicate below-average performance relative to the baseline population. A decline of 0.2-0.3 standard deviations is generally considered a small but clinically detectable change in global cognition. This composite metric serves as a comprehensive indicator of overall cognitive performance, where elevated scores correspond to superior global cognitive functioning[18].
Covariates
The analyses incorporated the following covariates to control for potential confounding factors that are either established or hypothesized to be linked with arterial stiffness and cognitive trajectory. Socio-demographic and lifestyle factors comprised gender (male/female), and educational attainment. Education was categorized into “higher” (holding A-level qualifications, a university degree, or equivalent) and “lower” (qualifications below A-level or no formal qualifications). Living status was dichotomized as living alone versus living with others (spouse, family, or partners). Smoking status was defined as current smoker versus non-smoker (including former and never smokers). Alcohol consumption was classified as regular drinker (consuming alcohol at least once a week) versus non-regular drinker. Clinical parameters and cardiovascular risk factors encompassed body mass index (BMI), which was derived from measured height and weight. Hypertension was defined as SBP ≥ 140 mmHg, DBP ≥ 90 mmHg, or current use of antihypertensive medication. This threshold aligns with the UK NICE and ESC/ESH guidelines that were clinically applicable during the study period and ensures consistency with prior ELSA-based research. Diabetes mellitus was defined as a glycated hemoglobin (HbA1c) level ≥ 6.5%, a fasting plasma glucose ≥ 7.0 mmol/L, or reported use of antidiabetic medication. Blood biomarkers included total cholesterol (TC), triglycerides (TG), high-density lipoprotein cholesterol (HDL-C), and high-sensitivity C-reactive protein (hs-CRP), all measured from fasting blood samples using standard laboratory assays at the Royal Victoria Infirmary[14]. Depressive symptoms were assessed using the 8-item version of the Center for Epidemiologic Studies Depression Scale (CES-D)[19]. A score of ≥ 4 was used to indicate the presence of clinically relevant depressive symptoms, consistent with established cut-offs in ageing populations. Prevalent chronic diseases were determined based on self-reported, physician-diagnosed conditions. These comprised coronary heart disease (including angina or myocardial infarction), stroke, chronic lung disease, and asthma. All covariates were assessed at baseline (wave 2) unless otherwise indicated. Their inclusion in statistical models was based on existing evidence linking them to vascular health, systemic inflammation, and cognitive ageing[20].
Statistical analysis
All statistical analyses were conducted using R software (version 4.4.2). Continuous variables are expressed as mean (± standard deviation) for normally distributed data or as median [Q1, Q3] for non-normally distributed data; categorical variables are reported as frequencies (percentages). The exposure variable, ePWV, was natural log-transformed [ln(ePWV)] to address positive skewness and improve model fit. This conversion enables interpretation on a relative scale, with coefficients indicating the change in cognitive score associated with each proportional increase in ePWV [21].
Cross-sectional analyses at baseline (Wave 2) employed multivariable linear regression to assess associations between ln(ePWV) and four cognitive domains: global, memory, executive function, and orientation scores. A sequential adjustment strategy was used: Model 1 adjusted for depressive symptoms; Model 2 added sociodemographic/lifestyle factors (gender, education, living status, smoking, alcohol); Model 3 further added biological/clinical covariates (TC, TG, HDL-C, BMI, hs-CRP, diabetes, coronary heart disease, stroke, chronic lung disease, asthma)[20]. Given that ePWV is derived from age and MBP, these variables were not included in the multivariable models to avoid multicollinearity and to focus on the integrated measure of arterial stiffness. Standardized coefficients (β) with 95% confidence intervals were computed to facilitate effect size comparisons across domains.
Longitudinal analyses used linear mixed-effects models with subject-specific random intercepts and random slopes for time to evaluate associations between baseline ln(ePWV) and cognitive change over Waves 2-9[22]. Cognitive scores were standardized within each domain using baseline (Wave 2) means and standard deviations. We employed two complementary approaches: (1) continuous analysis with standardized ln(ePWV) as predictor; (2) quartile-based analysis (Q1-Q4, Q1 reference). ePWV quartiles were defined using the sample-specific distribution of baseline ePWV (25th, 50th, and 75th percentiles). In sensitivity analyses, quartiles were recalculated within the relevant subsample. Both approaches included time, the time-by-ePWV interaction (primary term of interest), and all Model 3 covariates as fixed effects. For quartile analyses, linear trend was tested by treating quartiles as an ordinal variable. Models used restricted maximum likelihood estimation, included all available data, and were compared via Akaike Information Criterion (AIC).
Sensitivity analyses included: (1) exclusion of participants with baseline cardiovascular disease; (2) multiple imputation (20 datasets, predictive mean matching) for missing cognitive data. Cognitive trajectories were visualized by plotting mean scores with 95% confidence intervals at Waves 2 and 9 for each quartile; (3) All p-values were two-sided (α = 0.05). For the quartile-based analyses, we also report p-values for trend tests, which examine whether cognitive decline increases linearly across ePWV quartiles.
RESULTS
Baseline characteristics and sample size
The final analytical sample comprised 5,080 participants (57.6% women) with a median age of 64.0 years [interquartile range (IQR): 58.0-72.0]. ePWV values ranged from 2.8 to 14.2, with a median of 6.8 and an interquartile range of 5.9-8.1. The distribution of ePWV was positively skewed in this population [Supplementary Figure 2]. As presented in Table 1, multiple baseline characteristics exhibited a linear relationship across increasing quartiles of ePWV. These included age, TC, hs-CRP, attainment of higher education, living alone, presence of depressive symptoms, current smoking, regular alcohol consumption, and history of coronary heart disease, stroke, and chronic lung disease. Cognitive performance at baseline, as reflected in global, memory, executive function, and orientation scores, also varied systematically with ePWV quartiles. Cognitive function was assessed at baseline (Wave 2) and subsequently every two years through Wave 9. Participant retention across waves was as follows: 5080 (Wave 2), 4868 (Wave 3), 4300 (Wave 4), 3983 (Wave 5), 3679 (Wave 6), 3233 (Wave 7), 2818 (Wave 8), and 2455 (Wave 9). The mean duration of follow-up was 10.1 (± 4.5) years, and participants completed an average of 4.2 (± 1.8) cognitive assessments during the study period.
Characteristics of the study participants at baseline (wave 2), according to baseline ePWV quartiles
| Characteristic | Baseline characteristics by ePWV quartiles (m/s) | P for trenda | |||
| Q1 (n = 1,348): ≤ 5.9 | Q2 (n = 1,366): 5.9-6.8 | Q3 (n = 1,261): 6.8-8.1 | Q4 (n = 1,105): > 8.1 | ||
| Age (years) | 57.0 [54.0, 60.0] | 61.0 [57.0, 65.0] | 68.0 [64.0, 72.0] | 78.0 [74.0, 82.0] | < 0.001 |
| Female (%) | 777 (57.6) | 726 (53.1) | 659 (52.3) | 638 (57.7) | 0.755 |
| TC (mmol/L) | 5.9 [5.2, 6.7] | 6.0 [5.2, 6.8] | 5.9 [5.1, 6.7] | 5.8 [4.9, 6.7] | 0.005 |
| TG (mmol/L) | 1.5 [1.0, 2.2] | 1.5 [1.1, 2.2] | 1.6 [1.1, 2.2] | 1.5 [1.1, 2.2] | 0.229 |
| HDL-C (mmol/L) | 1.5 [1.2, 1.8] | 1.5 [1.3, 1.8] | 1.5 [1.2, 1.7] | 1.5 [1.3, 1.8] | 0.850 |
| hs-CRP (mg/L) | 1.6 [0.7, 3.4] | 1.8 [0.9, 3.9] | 2.1 [1.1, 4.3] | 2.4 [1.2, 4.8] | < 0.001 |
| BMI (kg/m^2) | 26.7 [24.0, 30.0] | 27.4 [24.9, 30.7] | 27.5 [25.1, 30.8] | 26.9 [24.6, 30.2] | 0.125 |
| Education ≥ NVQ3/GCE A level (%) | 850 (63.1) | 793 (58.1) | 616 (48.9) | 401 (36.3) | < 0.001 |
| Living alone (%) | 194 (14.4) | 230 (16.8) | 302 (23.9) | 498 (45.1) | <0.001 |
| Depressive symptoms (%) | 168 (12.5) | 177 (13.0) | 172 (13.6) | 174 (15.7) | 0.019 |
| Current smoking (%) | 248 (18.4) | 190 (13.9) | 168 (13.3) | 93 (8.4) | <0.001 |
| Alcoholic drink ≥ once per week (%) | 918 (73.5) | 890 (71.0) | 815 (70.4) | 584 (61.7) | <0.001 |
| Diabetes (%) | 109 (8.1) | 103 (7.5) | 113 (9.0) | 94 (8.5) | 0.433 |
| Coronary heart disease (%) | 158 (11.7) | 168 (12.3) | 188 (14.9) | 241 (21.8) | <0.001 |
| Stroke (%) | 21 (1.6) | 29 (2.1) | 36 (2.9) | 59 (5.3) | <0.001 |
| Chronic lung disease (%) | 64 (4.7) | 67 (4.9) | 78 (6.2) | 80 (7.2) | 0.003 |
| Asthma (%) | 167 (12.4) | 177 (13.0) | 141 (11.2) | 132 (11.9) | 0.438 |
| Global cognitive scores | 37.0 [32.0, 42.0] | 36.0 [31.0, 41.0] | 34.0 [29.0, 39.0] | 30.0 [25.0, 35.0] | < 0.001 |
| Memory scores | 12.0 [10.0, 14.0] | 11.0 [9.0, 13.0] | 10.0 [8.0, 12.0] | 9.0 [6.0, 11.0] | < 0.001 |
| Executive function scores | 22.0 [18.0, 26.0] | 21.0 [17.0, 25.0] | 20.0 [16.0, 24.0] | 18.0 [14.0, 22.0] | < 0.001 |
| Orientation scores | 4.0 [4.0, 4.0] | 4.0 [4.0, 4.0] | 4.0 [4.0, 4.0] | 4.0 [3.0, 4.0] | < 0.001 |
Baseline ePWV levels and cognitive scores (cross-sectional analyses)
Table 2 presents the cross-sectional associations between baseline ln(ePWV) and cognitive function at Wave 2. In the fully adjusted model (Model 3), each unit increase in ln(ePWV) was associated with lower global cognitive score [β (β is the regression coefficient, representing the average change in the outcome for each one-unit increase in the predictor) = -0.221, 95% CI: -0.249 to -0.193], poorer memory (β = -0.241, 95% CI: -0.270 to -0.212), reduced executive function (β = -0.152, 95% CI: -0.182 to -0.123), and worse orientation (β = -0.116, 95% CI: -0.147 to -0.085) (all P < 0.001). While the strength of the association (β coefficient) attenuated slightly from Model 1 to Model 3 for global, memory, and executive function scores, the proportion of variance explained (R2) by the models increased, indicating the contribution of the added covariates.
Linear associations between baseline ePWV (natural log-transformed) and cognitive scores: cross-sectional analyses using multiple linear regressions
| Baseline cognitive scores | Model 1a | Model 2b | Model 3c | ||||||
| β (95% CI) | P value | R2 | β (95% CI) | P value | R2 | β (95% CI) | P value | R2 | |
| Global cognitive scores | -0.320 (-0.346 to -0.294) | < 0.001 | 0.116 | -0.225 (-0.253 to -0.197) | < 0.001 | 0.197 | -0.221 (-0.249 to -0.193) | < 0.001 | 0.198 |
| Memory scores | -0.325 (-0.351 to -0.299) | < 0.001 | 0.112 | -0.244 (-0.272 to -0.216) | < 0.001 | 0.176 | -0.241 (-0.270 to -0.212) | < 0.001 | 0.176 |
| Executive function scores | -0.238 (-0.265 to -0.211) | < 0.001 | 0.069 | -0.156 (-0.185 to -0.127) | < 0.001 | 0.132 | -0.152 (-0.182 to -0.123) | < 0.001 | 0.133 |
| Orientation scores | -0.153 (-0.181 to -0.126) | < 0.001 | 0.025 | -0.116 (-0.147 to -0.086) | < 0.001 | 0.029 | -0.116 (-0.147 to -0.085) | < 0.001 | 0.034 |
Baseline ePWV levels and cognitive decline (longitudinal analyses)
Longitudinal analyses based on linear mixed-effects models demonstrated a significant association between higher baseline arterial stiffness, measured by ln(ePWV), and an accelerated rate of decline in cognitive function over the follow-up period [Table 3]. For global cognition, a significant negative interaction was found between time and baseline ln(ePWV) (β = -0.024, 95% CI: -0.026 to -0.021). This indicates that a higher baseline arterial stiffness level was associated with a steeper decline in global cognitive scores over time. This pattern was consistent across specific cognitive domains: higher baseline ln(ePWV) predicted a faster rate of decline in both memory [ln(ePWV) × time interaction: β = -0.022, 95% CI: -0.024 to -0.019] and executive function [ln(ePWV) × time interaction: β = -0.019, 95% CI: -0.022 to -0.016]. A significant interaction was also observed for orientation scores [ln(ePWV) × time: β = -0.017, 95% CI: -0.021 to -0.013]. Furthermore, the main effect of baseline ln(ePWV) was significantly and negatively associated with scores in all cognitive domains at baseline, confirming its cross-sectional link to poorer cognitive performance.
Association between baseline ePWV (natural log-transformed) and rate of change in cognitive scores (points/year): longitudinal analyses using linear mixed models
| Model terms for cognitive scores | β (95% CI)a | P value |
| Global cognitive scores. Model fit, AIC = 49,519.9 | ||
| Time | -0.030 (-0.033 to -0.028) | < 0.001 |
| Ln (ePWV) | -0.193 (-0.216 to -0.169) | < 0.001 |
| Ln (ePWV) × time | -0.024 (-0.026 to -0.021) | < 0.001 |
| Memory scores. Model fit, AIC = 60,198.0 | ||
| Time | -0.038 (-0.040 to -0.036) | < 0.001 |
| Ln (ePWV) | -0.215 (-0.238 to -0.192) | < 0.001 |
| Ln (ePWV) × time | -0.022 (-0.024 to -0.019) | < 0.001 |
| Executive function scores. Model fit, AIC = 54,875.0 | ||
| Time | -0.020 (-0.022 to -0.017) | < 0.001 |
| Ln (ePWV) | -0.140 (-0.164 to -0.115) | < 0.001 |
| Ln (ePWV) × time | -0.019 (-0.022 to -0.016) | < 0.001 |
| Orientation scores. Model fit, AIC = 71,436.0 | ||
| Time | -0.024 (-0.027 to -0.020) | < 0.001 |
| Ln (ePWV) | -0.080 (-0.099 to -0.061) | < 0.001 |
| Ln (ePWV) × time | -0.017 (-0.021 to -0.013) | < 0.001 |
Figure 1 shows the trajectories of cognitive scores by baseline ePWV quartiles from waves 2 to 9. A clear graded association was observed between higher baseline ePWV quartiles and faster cognitive decline in the fully adjusted model [Table 4]. Compared to the lowest quartile (Q1), the annual rate of global cognitive decline was progressively faster across Q2 (mean difference: -0.030 points/year), Q3 (-0.068), and Q4 (-0.128) (P for trend < 0.001). Significant dose-response trends were also present for memory and executive function (both P for trend < 0.001). The decline associated with the highest ePWV quartile (Q4) was -0.118 points/year for memory and -0.102 points/year for executive function, relative to Q1. For orientation, while the overall trend was significant (P for trend < 0.001), the association was not strictly monotonic. Only Q3 and Q4 showed a statistically significant acceleration in decline compared to Q1.
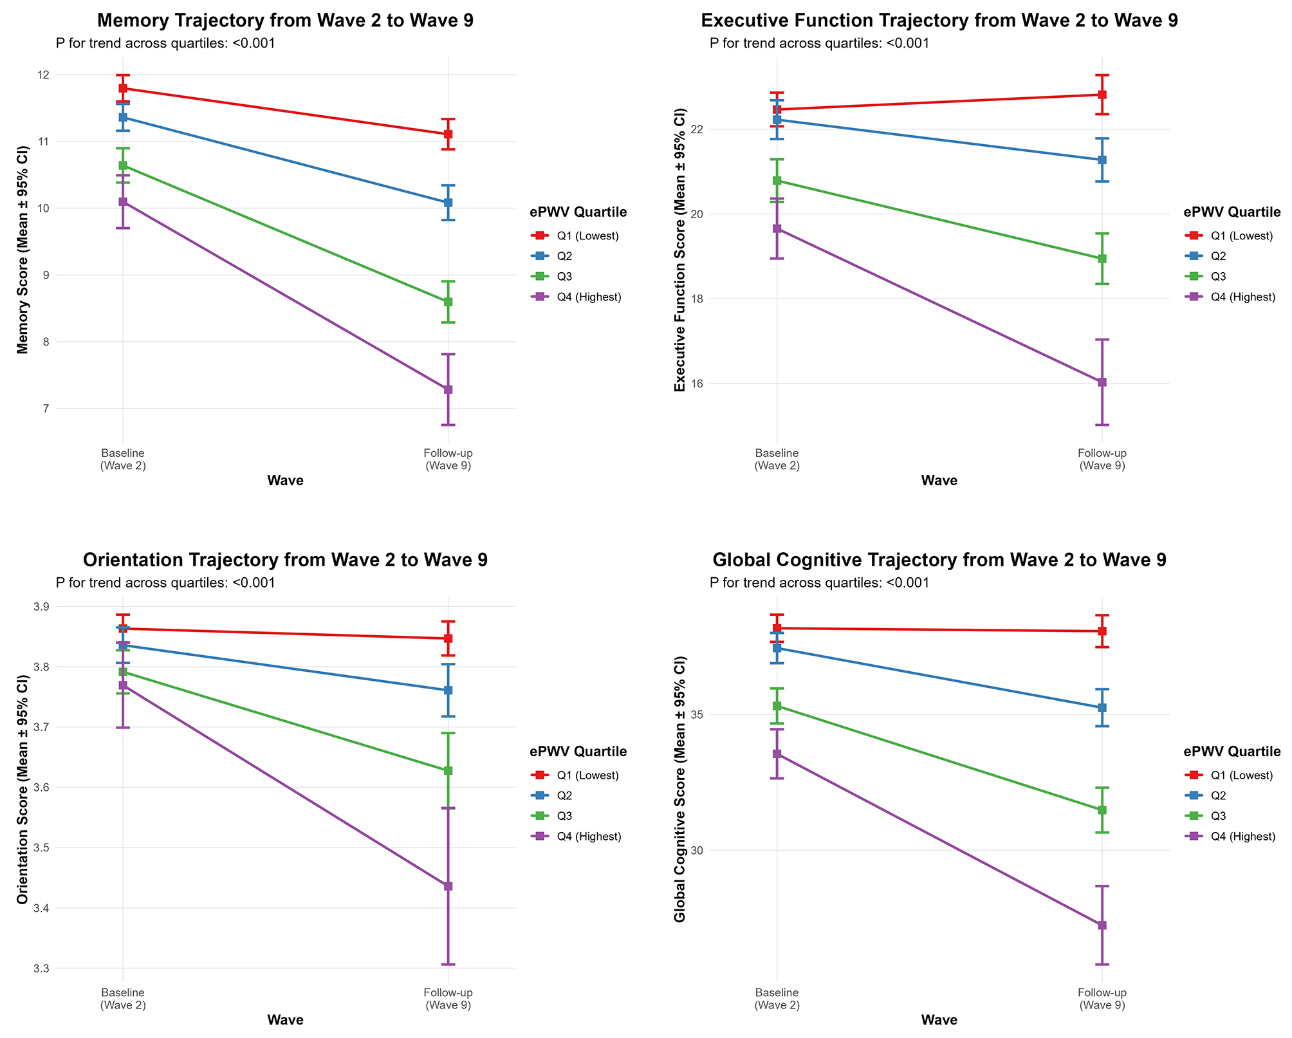
Figure 1. The trajectories of cognitive scores by baseline ePWV quartiles from Wave 2 to Wave 9. Error bars represent 95% confidence intervals. ePWV: Estimated pulse-wave velocity; CI: confidence interval.
Mean difference in rate of change in cognitive scores (points/year) comparing quartiles of baseline ePWV: longitudinal analyses using linear mixed models
| Model terms for cognitive scores | Mean difference (95% CI) in rate of change by ePWV quartiles (m/s) | P for trend | |||
| Q1 (n = 1,348): ≤ 5.9 | Q2 (n = 1,366): 5.9-6.8 | Q3 (n = 1,261): 6.8-8.1 | Q4 (n = 1,105): > 8.1 | ||
| Global cognitive scores | |||||
| Model 1a, AIC = 56,936.7 | 0.000 (ref) | -0.028 (-0.039 to -0.017) | -0.067 (-0.079 to -0.056) | -0.125 (-0.139 to -0.111) | <0.001 |
| Model 2b, AIC = 51,235.8 | 0.000 (ref) | -0.029 (-0.040 to -0.017) | -0.067 (-0.079 to -0.055) | -0.125 (-0.139 to -0.110) | <0.001 |
| Model 3c, AIC = 49,595.2 | 0.000 (ref) | -0.030 (-0.042 to -0.019) | -0.068 (-0.080 to -0.056) | -0.128 (-0.143 to -0.113) | <0.001 |
| Memory scores | |||||
| Model 1a, AIC = 68985.6 | 0.000 (ref) | -0.027 (-0.038 to -0.016) | -0.066 (-0.077 to -0.054) | -0.114 (-0.128 to -0.101) | <0.001 |
| Model 2b, AIC = 62195.6 | 0.000 (ref) | -0.027 (-0.039 to -0.016) | -0.064 (-0.076 to -0.052) | -0.113 (-0.128 to -0.099) | <0.001 |
| Model 3c, AIC = 60274.3 | 0.000 (ref) | -0.029 (-0.040 to -0.018) | -0.066 (-0.078 to -0.054) | -0.118 (-0.132 to -0.103) | <0.001 |
| Executive function scores | |||||
| Model 1a, AIC = 62413.9 | 0.000 (ref) | -0.024 (-0.036 to -0.013) | -0.054 (-0.066 to -0.042) | -0.097 (-0.111 to -0.082) | < 0.001 |
| Model 2b, AIC = 56648.6 | 0.000 (ref) | -0.026 (-0.038 to -0.014) | -0.054 (-0.067 to -0.042) | -0.098 (-0.114 to -0.083) | < 0.001 |
| Model 3c, AIC = 54928.8 | 0.000 (ref) | -0.027 (-0.039 to -0.015) | -0.055 (-0.068 to -0.043) | -0.102 (-0.118 to -0.086) | < 0.001 |
| Orientation scores | |||||
| Model 1a, AIC = 82376.7 | 0.000 (ref) | -0.010 (-0.025 to 0.006) | -0.038 (-0.054 to -0.021) | -0.089 (-0.108 to -0.069) | < 0.001 |
| Model 2b, AIC = 73761.4 | 0.000 (ref) | -0.011 (-0.027 to 0.005) | -0.039 (-0.056 to -0.022) | -0.089 (-0.109 to -0.069) | < 0.001 |
| Model 3c, AIC = 71199.7 | 0.000 (ref) | -0.013 (-0.029 to 0.003) | -0.040 (-0.057 to -0.023) | -0.091 (-0.111 to -0.070) | < 0.001 |
Attrition and missing data analyses
A total of 3,773 participants (40%) were excluded from the analysis because they had incomplete baseline information or a confirmed diagnosis of dementia and/or Alzheimer’s disease. An additional 579 individuals (6%) were lost during follow-up. Overall, when compared to the participants who were included in the study, those who were excluded tended to be older, had a higher occurrence of cardiovascular risk factors, lower levels of education, and performed worse on baseline cognitive assessments across all measured domains [Supplementary Tables 1 and 2]. This may indicate a selection bias toward a healthier population, which should be taken into account when extending the conclusions to broader populations.
Sensitivity analyses
We conducted sensitivity analyses to assess the robustness of our primary results. After removing participants who had cardiovascular disease at baseline (n = 4,234), the relationship between ePWV and cognitive decline continued to be statistically significant and largely aligned with the findings from the main analysis [Supplementary Tables 3 and 4]. Furthermore, to address missing cognitive assessment data during follow-up, we conducted multiple imputation using chained equations (n = 5,080), generating 20 imputed datasets. The imputation model included all cognitive scores at each follow-up wave, and all covariates used in the main analyses (sociodemographic, lifestyle, and clinical variables). The results continued to show a stable longitudinal association between ePWV and cognitive decline, with no substantial changes observed [Supplementary Tables 5 and 6]. These analyses suggest that our main conclusions are not markedly influenced by baseline cardiovascular disease status or missing cognitive data.
DISCUSSION
Comparison with existing research results
Our study offers robust longitudinal evidence demonstrating that increased ePWV, a surrogate marker of arterial stiffness calculated from age and MBP, is independently linked to accelerated cognitive decline in a large, nationally representative cohort of older adults in England over a 14-year follow-up period. This association persisted as significant following adjustment for a comprehensive set of demographic, lifestyle, and clinical confounding factors. These results add to the accumulating evidence underscoring the role of vascular factors in cognitive aging, and further corroborate and extend previous research findings. Multiple cross-sectional and short-term longitudinal studies have reported inverse associations between ePWV and cognitive function across diverse populations. For instance, Heffernan et al. (2022) using National Health and Nutrition Examination Survey (NHANES) data found significant inverse associations between ePWV and performance on the Digit Symbol Substitution Test among older non-Hispanic Black and White adults[23]. Our research builds on these results by showing comparable links across a wider spectrum of cognitive domains - including memory (assessed by 10-word immediate and delayed recall), executive function, and orientation - and, importantly, over an extended follow-up period, reinforcing the temporality and potential causal relevance of the relationship. Furthermore, our findings are consistent with post-hoc analyses from the SPRINT-MIND trial (Hao et al.,2024), which demonstrated that higher ePWV tertiles were associated with significantly increased risk of mild cognitive impairment and probable dementia[24]. However, while SPRINT-MIND focused on clinical diagnoses as endpoints, our study evaluated domain-specific cognitive trajectories over time, offering amore granular view of cognitive aging and detecting subclinical changes that may precede overt impairment.
The Northern Manhattan Study (Aimagambetova et al.,2024) further highlighted the relevance of arterial stiffness across racial and ethnic lines, demonstrating that higher ePWV predicted worse performance and greater cognitive decline across multiple domains in a multiethnic cohort[13]. Our results support these observations in a predominantly White English population, suggesting that the adverse cognitive consequences of vascular aging may be generalizable across populations, albeit with potential ethnic and sex-specific modifiers. Interestingly, our study parallels and extends findings from the Health and Retirement Study (Heffernan et al., 2024), which reported that elevated ePWV was associated with increased odds of dementia even after controlling for a wide array of confounders[25]. However, our focus on longitudinal change in specific cognitive domains, rather than categorical diagnostic outcomes, allows for earlier detection of at-risk individuals and a more nuanced understanding of how vascular aging translates into cognitive decline. Notably, our study also identifies a nonlinear association between ePWV and orientation decline, with significant effects only emerging in higher quartiles. This pattern was similarly echoed in the rural Chinese cohort study (Li et al., 2024), where a nonlinear spline relationship was observed between baseline ePWV and Mini-Mental State Examination (MMSE) score trajectories[12]. These findings suggest the existence of a vascular threshold beyond which cognitive vulnerability sharply increases, possibly due to an accumulation of microvascular damage or autoregulatory failure. From a neuropsychological standpoint, temporal orientation is often preserved until relatively advanced stages of cognitive decline, likely because it relies on highly rehearsed, schema-based knowledge and distributed neural networks that confer resilience against early vascular insults[26]. Consequently, a measurable decline in orientation may only emerge after the accumulation of microvascular damage surpasses a critical threshold, disrupting these compensatory mechanisms. Additionally, orientation performance is closely linked to the functional integrity of medial temporal and hippocampal regions, which may be less susceptible to mild pulsatile hemodynamic stress compared to frontal-subcortical circuits that support memory and executive functions[27]. This regional heterogeneity in vascular vulnerability directly aligns with our observation that memory and executive function declined linearly across ePWV quartiles, whereas orientation decline became apparent only at higher ePWV levels - consistent with a threshold-like effect and with recent reports of nonlinear associations between arterial stiffness and orientation. Nevertheless, we acknowledge that the 4-point orientation scale used in ELSA exhibits a pronounced ceiling effect, with the majority of participants scoring the maximum at baseline. This measurement property inherently limits sensitivity to early decline and may contribute to the apparent nonlinear trajectory. Our data cannot definitively distinguish between a genuine biological threshold and an artefact of scale compression. Future studies employing more sensitive and continuous measures of temporal orientation - or composite cognitive batteries with greater dynamic range - are needed to clarify this question.
Mechanistically, the link between arterial stiffness and cognitive decline is thought to involve several interrelated pathways. Increased arterial stiffness leads to augmented pulsatile flow and hemodynamic stress in cerebral microvessels, resulting in blood-brain barrier disruption, microbleeds, and white matter hyperintensities - all of which have been independently associated with cognitive impairment[28-30]. A recent study by Heffernan et al. (2025) using neuroimaging data from the MIDUS project confirmed that elevated ePWV in midlife predicts deterioration in white matter microstructural integrity over a decade later, highlighting a potential long-latency pathophysiological process through which vascular dysfunction affects brain aging[31]. Critically, the prefrontal cortex and hippocampus - regions essential for executive function and episodic memory - exhibit high metabolic demand and limited collateral flow, making them particularly vulnerable to neurovascular uncoupling caused by arterial stiffness. Recent longitudinal studies confirm that elevated ePWV predicts microstructural damage in these areas, which in turn mediates domain-specific cognitive decline[29,32]. Moreover, emerging evidence from mediation analyses (Jin et al., 2025) suggests that while blood pressure partially explains the association between ePWV and cognition, arterial stiffness exerts effects beyond those of static blood pressure levels[9]. Indeed, the nonlinear interaction between ePWV and blood pressure range in relation to cognitive outcomes emphasizes the complexity of vascular-cognitive coupling and the potential need for individualized management targets based on arterial compliance profiles.
Strengths and limitations
One of the major strengths of this study lies in the use of data from the ELSA, a large, well-characterized, and nationally representative cohort of older adults. The longitudinal design, combined with repeated cognitive assessments over several waves, allows for the evaluation of within-individual changes in cognitive function over time. This enhances the temporal validity of the observed associations between ePWV and cognitive decline, strengthening causal inferences beyond cross-sectional findings. Another strength is the use of ePWV, a non-invasive and easily obtainable measure derived from age and blood pressure, which offers a scalable alternative to direct measures of arterial stiffness such as cfPWV. Although it is a surrogate marker, ePWV has demonstrated strong correlations with direct measurements and can be readily implemented in large population studies. Additionally, the study applied a robust cognitive assessment framework covering multiple domains, including memory, executive function, and verbal fluency, which provides a more comprehensive picture of cognitive trajectories in aging.
However, the study has several limitations. The use of ePWV instead of direct arterial stiffness measures may introduce estimation errors and reduce the accuracy of individual-level assessments; consequently, while ePWV demonstrates robust associations at the population level, its utility for precise individual risk stratification may be limited without complementary validation. Moreover, although extensive covariate adjustment was applied, residual confounding from unmeasured variables - such as physical activity, diet quality, sleep disorders, genetic risk factors, inflammation, or subclinical neurovascular disease - cannot be ruled out. We also acknowledge that ePWV derived from single baseline blood pressure does not capture long-term variability or antihypertensive treatment effects; both factors would attenuate our estimates, rendering the findings conservative. Because ePWV is calculated from age and blood pressure, we did not adjust for these components in the same model to prevent collinearity; this approach aligns with the study’s aim to evaluate arterial stiffness as a composite vascular measure. We further acknowledge that age is a major component of the ePWV equation and is itself a strong predictor of cognitive decline; however, our aim was to evaluate the integrated vascular aging construct rather than to isolate age-independent effects, and the strong correlation between ePWV and age precludes their simultaneous inclusion in regression models. We acknowledge that this precludes formal statistical separation of the individual effects of age and MBP. However, our objective was to assess the prognostic utility of the integrated ePWV construct as a clinically scalable biomarker, rather than to decompose its physiological determinants. Future studies with repeated cfPWV measurements or interventional designs are needed to isolate the specific contribution of arterial stiffness independent of blood pressure. Selection bias may also have occurred due to the exclusion of ~ 40% of the Wave 2 sample with incomplete data or prevalent dementia; these individuals were older and had poorer cardiovascular and cognitive profiles, introducing a healthy participant bias that would attenuate the observed associations. Individuals with worse cardiovascular or cognitive profiles may also have been more likely to drop out or die during follow-up, further contributing to an underestimation of the true associations. Notably, sensitivity analyses using multiple imputation for missing cognitive data yielded consistent effect estimates, suggesting that our findings are robust to attrition under plausible missing-data assumptions. Nevertheless, sensitivity analyses excluding participants with baseline cardiovascular disease and using multiple imputation for missing cognitive data yielded consistent results, confirming the robustness of our main findings despite this potential bias. Additionally, although baseline ePWV has demonstrated prognostic value for long-term outcomes in multiple cohorts, we acknowledge that changes in arterial stiffness over time may also influence cognitive trajectories. Repeated ePWV measurements were not available, and including time-updated ePWV would introduce near-perfect collinearity with follow-up time, precluding such analysis. Future studies with serial ePWV or direct cfPWV assessments are needed to examine the impact of progressive vascular aging. Lastly, the findings may not be generalizable to non-English populations or institutionalized older adults, as the ELSA cohort's scope limits its direct integration into routine cardiovascular risk assessments in primary care or geriatric settings.
Implications for practice and research
In conclusion, this study provides robust evidence that higher ePWV - a surrogate marker of arterial stiffness - is significantly associated with accelerated cognitive decline in older adults. These findings underscore the key role of vascular health in preserving cognitive function and suggest ePWV as a potential biomarker for neurocognitive risk deserving further investigation. If confirmed, early identification of arterial stiffness could offer a window for interventions - such as antihypertensive therapy and lifestyle modifications - that may simultaneously reduce cardiovascular risk and delay neurodegeneration. Antihypertensive agents modulating the renin-angiotensin system reduce arterial stiffness beyond blood pressure lowering, and observational studies link them to slower cognitive decline. Aerobic exercise, sodium restriction, and the Mediterranean diet also improve arterial compliance and are associated with better cognitive outcomes. We propose evaluating ePWV in primary care as part of routine cardiovascular risk assessment to identify individuals at higher risk of cognitive decline. Future research should prioritize randomized trials testing whether reducing ePWV slows cognitive impairment, alongside mechanistic neuroimaging studies. Should consistent evidence emerge, integrating ePWV into geriatric assessments could facilitate early identification and proactive strategies to combat the growing dementia burden in aging populations.
DECLARATIONS
Acknowledgments
The authors express their gratitude to the original data creators, depositors, copyright holders, and the funders of the Data Collections, as well as the UK Data Archive, for providing access to data from the English Longitudinal Study of Ageing spanning waves 0–9, covering the period from 1998 to 2019. It is important to note that the original data creators, depositors, or copyright holders are not responsible for the analyses or interpretations presented in this study.
Authors’ contributions
Conceptualization: Li Z, Yan Y
Methodology: Li Z, Yan Y, Wang W
Software: Li Z, Yan Y, An B
Validation: Li Z, Yan Y, Fan X
Formal analysis: Li Z, Yan Y
Investigation: Bai Y
Resources: Zhao A
Data curation: Li Z, Duan R
Writing - original draft preparation: Li Z, Yan Y
Writing - review and editing: Liu S
Visualization: Li Z, Lü A, Wang W
Supervision: Liu S
Project administration: Liu S
Funding acquisition: Liu S
All authors have read and agreed to the published version of the manuscript.
Availability of data and materials
The dataset supporting the conclusions of this article is available in the English Longitudinal Study of Ageing (ELSA) repository, https://www.elsa-project.ac.uk/.
AI and AI-assisted tools statement
Not applicable.
Financial support and sponsorship
This work was supported by Collaborative Traditional Chinese and Modern Medicine for Chronic Disease Management Research Project (No. CXZH2024085); Shanxi Province Metabolic Disease (Type 1 Diabetes) Clinical Medical Research Center (No. 20240410501001); Shanxi Province Science and Technology Achievements Transformation Guidance Special Fund (No. 202304021301066); Shanxi Province Science and Technology Innovation Talent Team Special Plan (No. 202204051002029); Shanxi Province Research Funding for Returned Overseas Scholars (No. 2024-143); Shanxi Province Basic Research Program (No. 202303021212330); Shanxi Province Key Laboratory of Endocrine and Metabolic Diseases (No. 202404010920011).
Conflicts of interest
Liu S is the Guest Editor of the special issue entitled “Emerging Mechanisms and Therapeutic Strategies in Diabetic Cardiovascular Disease” in the journal Metabolism and Target Organ Damage. Liu S was not involved in any steps of editorial processing, notably including reviewers’ selection, manuscript handling and decision making. The other authors declare that there are no conflicts of interest.
Ethical approval and consent to participate
The ELSA investigation received ethical clearance from the London Multi-Centre Research Ethics Committee (approval number MREC/01/2/91), and written informed consent was secured from every participant. Further details regarding ELSA’s ethical oversight are available on the website: https://www.elsa-project.ac.uk/ethical-approval-and-consent.
Consent for publication
Not applicable.
Copyright
© The Author(s) 2026.
Supplementary Materials
REFERENCES
1. Herzog MJ, Müller P, Lechner K, et al. Arterial stiffness and vascular aging: mechanisms, prevention, and therapy. Signal Transduct Target Ther. 2025;10:282.
2. Zhang Y, Agnoletti D, Xu Y, Wang JG, Blacher J, Safar ME. Carotid-femoral pulse wave velocity in the elderly. J Hypertens. 2014;32. 1572-6; discussion 1576.
3. Greve SV, Laurent S, Olsen MH. Estimated pulse wave velocity calculated from age and mean arterial blood pressure. Pulse (Basel). 2017;4:175-9.
4. Greve SV, Blicher MK, Kruger R, et al. Estimated carotid-femoral pulse wave velocity has similar predictive value as measured carotid-femoral pulse wave velocity. J Hypertens. 2016;34:1279-89.
5. Li J, Gao F, Cao F, et al. Association of estimated pulse wave velocity with cardiovascular disease outcomes and all-cause death-a systematic review and meta-analysis. Front Cardiovasc Med. 2025;12:1641697.
6. Moore EE, Liu D, Li J, et al. Association of aortic stiffness with biomarkers of neuroinflammation, synaptic dysfunction, and neurodegeneration. Neurology. 2021;97:e329-40.
7. Wang WT, Chang WL, Cheng HM. The relationship of vascular aging to reduced cognitive function: pulsatile and steady state arterial hemodynamics. Pulse (Basel). 2022;10:19-25.
9. Jin J, Bao C, Wang C, Ge W, Gu Q. Vascular ageing and cognitive function: blood pressure mediation in the association between arterial stiffness and cognitive decline in Chinese adults. Age Ageing. 2025;54:afaf274.
10. Thorin-Trescases N, de Montgolfier O, Pinçon A, et al. Impact of pulse pressure on cerebrovascular events leading to age-related cognitive decline. Am J Physiol Heart Circ Physiol. 2018;314:H1214-24.
11. Alvarez-Bueno C, Cunha PG, Martinez-Vizcaino V, et al. Arterial stiffness and cognition among adults: a systematic review and meta-analysis of observational and longitudinal studies. J Am Heart Assoc. 2020;9:e014621.
12. Li J, Ren Y, Wang L, et al. Estimated pulse wave velocity associated with cognitive phenotypes in a rural older population in China: a cohort study. Alzheimers Dement. 2025;21:e14491.
13. Aimagambetova B, Ariko T, Gardener H, et al. Association of estimated pulse wave velocity with cognitive function in a multiethnic diverse population: The Northern Manhattan Study. Alzheimers Dement. 2024;20:4903-13.
14. Steptoe A, Breeze E, Banks J, Nazroo J. Cohort profile: the English longitudinal study of ageing. Int J Epidemiol. 2013;42:1640-8.
15. Shi J, Shen X, Tian Y, et al. Association of memory function with COVID-19 outcomes in adults aged 50 years and older: analysis of three prospective cohorts. Front Public Health. 2025;13:1577334.
16. Lara E, Miret M, Sanchez-Niubo A, et al. Episodic memory and verbal fluency tasks: normative data from nine nationally representative samples. J Int Neuropsychol Soc. 2021;27:89-98.
17. O'Keeffe E, Mukhtar O, O'Keeffe ST. Orientation to time as a guide to the presence and severity of cognitive impairment in older hospital patients. J Neurol Neurosurg Psychiatry. 2011;82:500-4.
18. Li J, Ortí-Casañ N, Bayraktaroglu I, et al. Psychosocial stressors and cognitive function: An analysis using data from the English longitudinal study of ageing. J Prev Alzheimers Dis. 2025;12:100232.
19. Wang Y, Liu M, Yang F, Chen H, Wang Y, Liu J. The associations of socioeconomic status, social activities, and loneliness with depressive symptoms in adults aged 50 years and older across 24 countries: findings from five prospective cohort studies. Lancet Healthy Longev. 2024;5:100618.
20. Zheng F, Xie W. High-sensitivity C-reactive protein and cognitive decline: the English longitudinal study of ageing. Psychol Med. 2018;48:1381-9.
21. Wang B, Xu W, Mei Z, Yang W, Meng X, An G. Association between serum Klotho levels and estimated pulse wave velocity in postmenopausal women: a cross-sectional study of NHANES 2007-2016. Front Endocrinol (Lausanne). 2024;15:1471548.
22. Hanff AM, Krüger R, McCrum C, Ley C. ; NCER-PD. Mixed effects models but not t-tests or linear regression detect progression of apathy in Parkinson’s disease over seven years in a cohort: a comparative analysis. BMC Med Res Methodol. 2024;24:183.
23. Heffernan KS, Stoner L, Meyer ML, Loprinzi PD. Association between estimated pulse wave velocity and cognitive performance in older black and white adults in NHANES. J Alzheimers Dis. 2022;88:985-93.
24. Hao P, Feng S, Suo M, Wang S, Zheng K, Wu X. Estimated pulse wave velocity and cognitive outcomes: a post hoc analysis of SPRINT-MIND. Am J Hypertens. 2024;37:485-92.
25. Heffernan KS, Wilmoth JM, London AS. Estimated pulse wave velocity is associated with a higher risk of dementia in the health and retirement study. Am J Hypertens. 2024;37:909-15.
26. Requena-Komuro MC, Jiang J, Benhamou E, et al. Subjective time perception in dementia: a behavioural and neuroanatomical analysis. Brain Commun. 2026;8:fcaf496.
27. Choo Y, Thakurdesai SP, Qadri A, et al. Medial temporal lobe lesions reduce visual working memory precision. Brain. 2025:>awaf397.
28. Bowie DC, Low KA, Rubenstein SL, et al. Neurovascular mechanisms of cognitive aging: Sex-related differences in the average progression of arteriosclerosis, white matter atrophy, and cognitive decline. Neurobiol Dis. 2024;201:106653.
29. Yu R, Espinosa N, Kong S, Mundell H, Michaelian JC, Naismith SL. Arterial stiffness is associated with prefrontal cortex integrity in ageing. Geroscience. 2025.
30. Low S, Goh KS, Moh A, et al. Basic science and pathogenesis. Alzheimers Dement. 2025;21 Suppl 1:e098722.
31. Heffernan KS, Monroe DC, London AS, et al. High estimated pulse-wave velocity is associated with lower brain white matter microstructural integrity twelve years later. Neurobiol Aging. 2025;156:1-9.
Cite This Article
How to Cite
Download Citation
Export Citation File:
Type of Import
Tips on Downloading Citation
Citation Manager File Format
Type of Import
Direct Import: When the Direct Import option is selected (the default state), a dialogue box will give you the option to Save or Open the downloaded citation data. Choosing Open will either launch your citation manager or give you a choice of applications with which to use the metadata. The Save option saves the file locally for later use.
Indirect Import: When the Indirect Import option is selected, the metadata is displayed and may be copied and pasted as needed.
About This Article
Special Topic
Copyright

Data & Comments
Data
0


Comments
Comments must be written in English. Spam, offensive content, impersonation, and private information will not be permitted. If any comment is reported and identified as inappropriate content by OAE staff, the comment will be removed without notice. If you have any queries or need any help, please contact us at support@oaepublish.com.