


Causal relationships among seven cardiovascular-associated metabolic diseases: insights from a bidirectional Mendelian randomization study
 0
0 Abstract
Aim: Previous studies have suggested that metabolic diseases are gene- and heritability-related and there are potential cross-genetic correlations. We aim to elucidate the causal relationships among specific metabolic diseases.
Methods: We investigated seven metabolic diseases by analyzing summary statistics from Genome-Wide Association Studies (GWAS). Genetic correlations and pleiotropic associations were identified, and biological functions were determined. In addition, two-sample bidirectional Mendelian randomization (MR) analysis was performed to establish causal inferences.
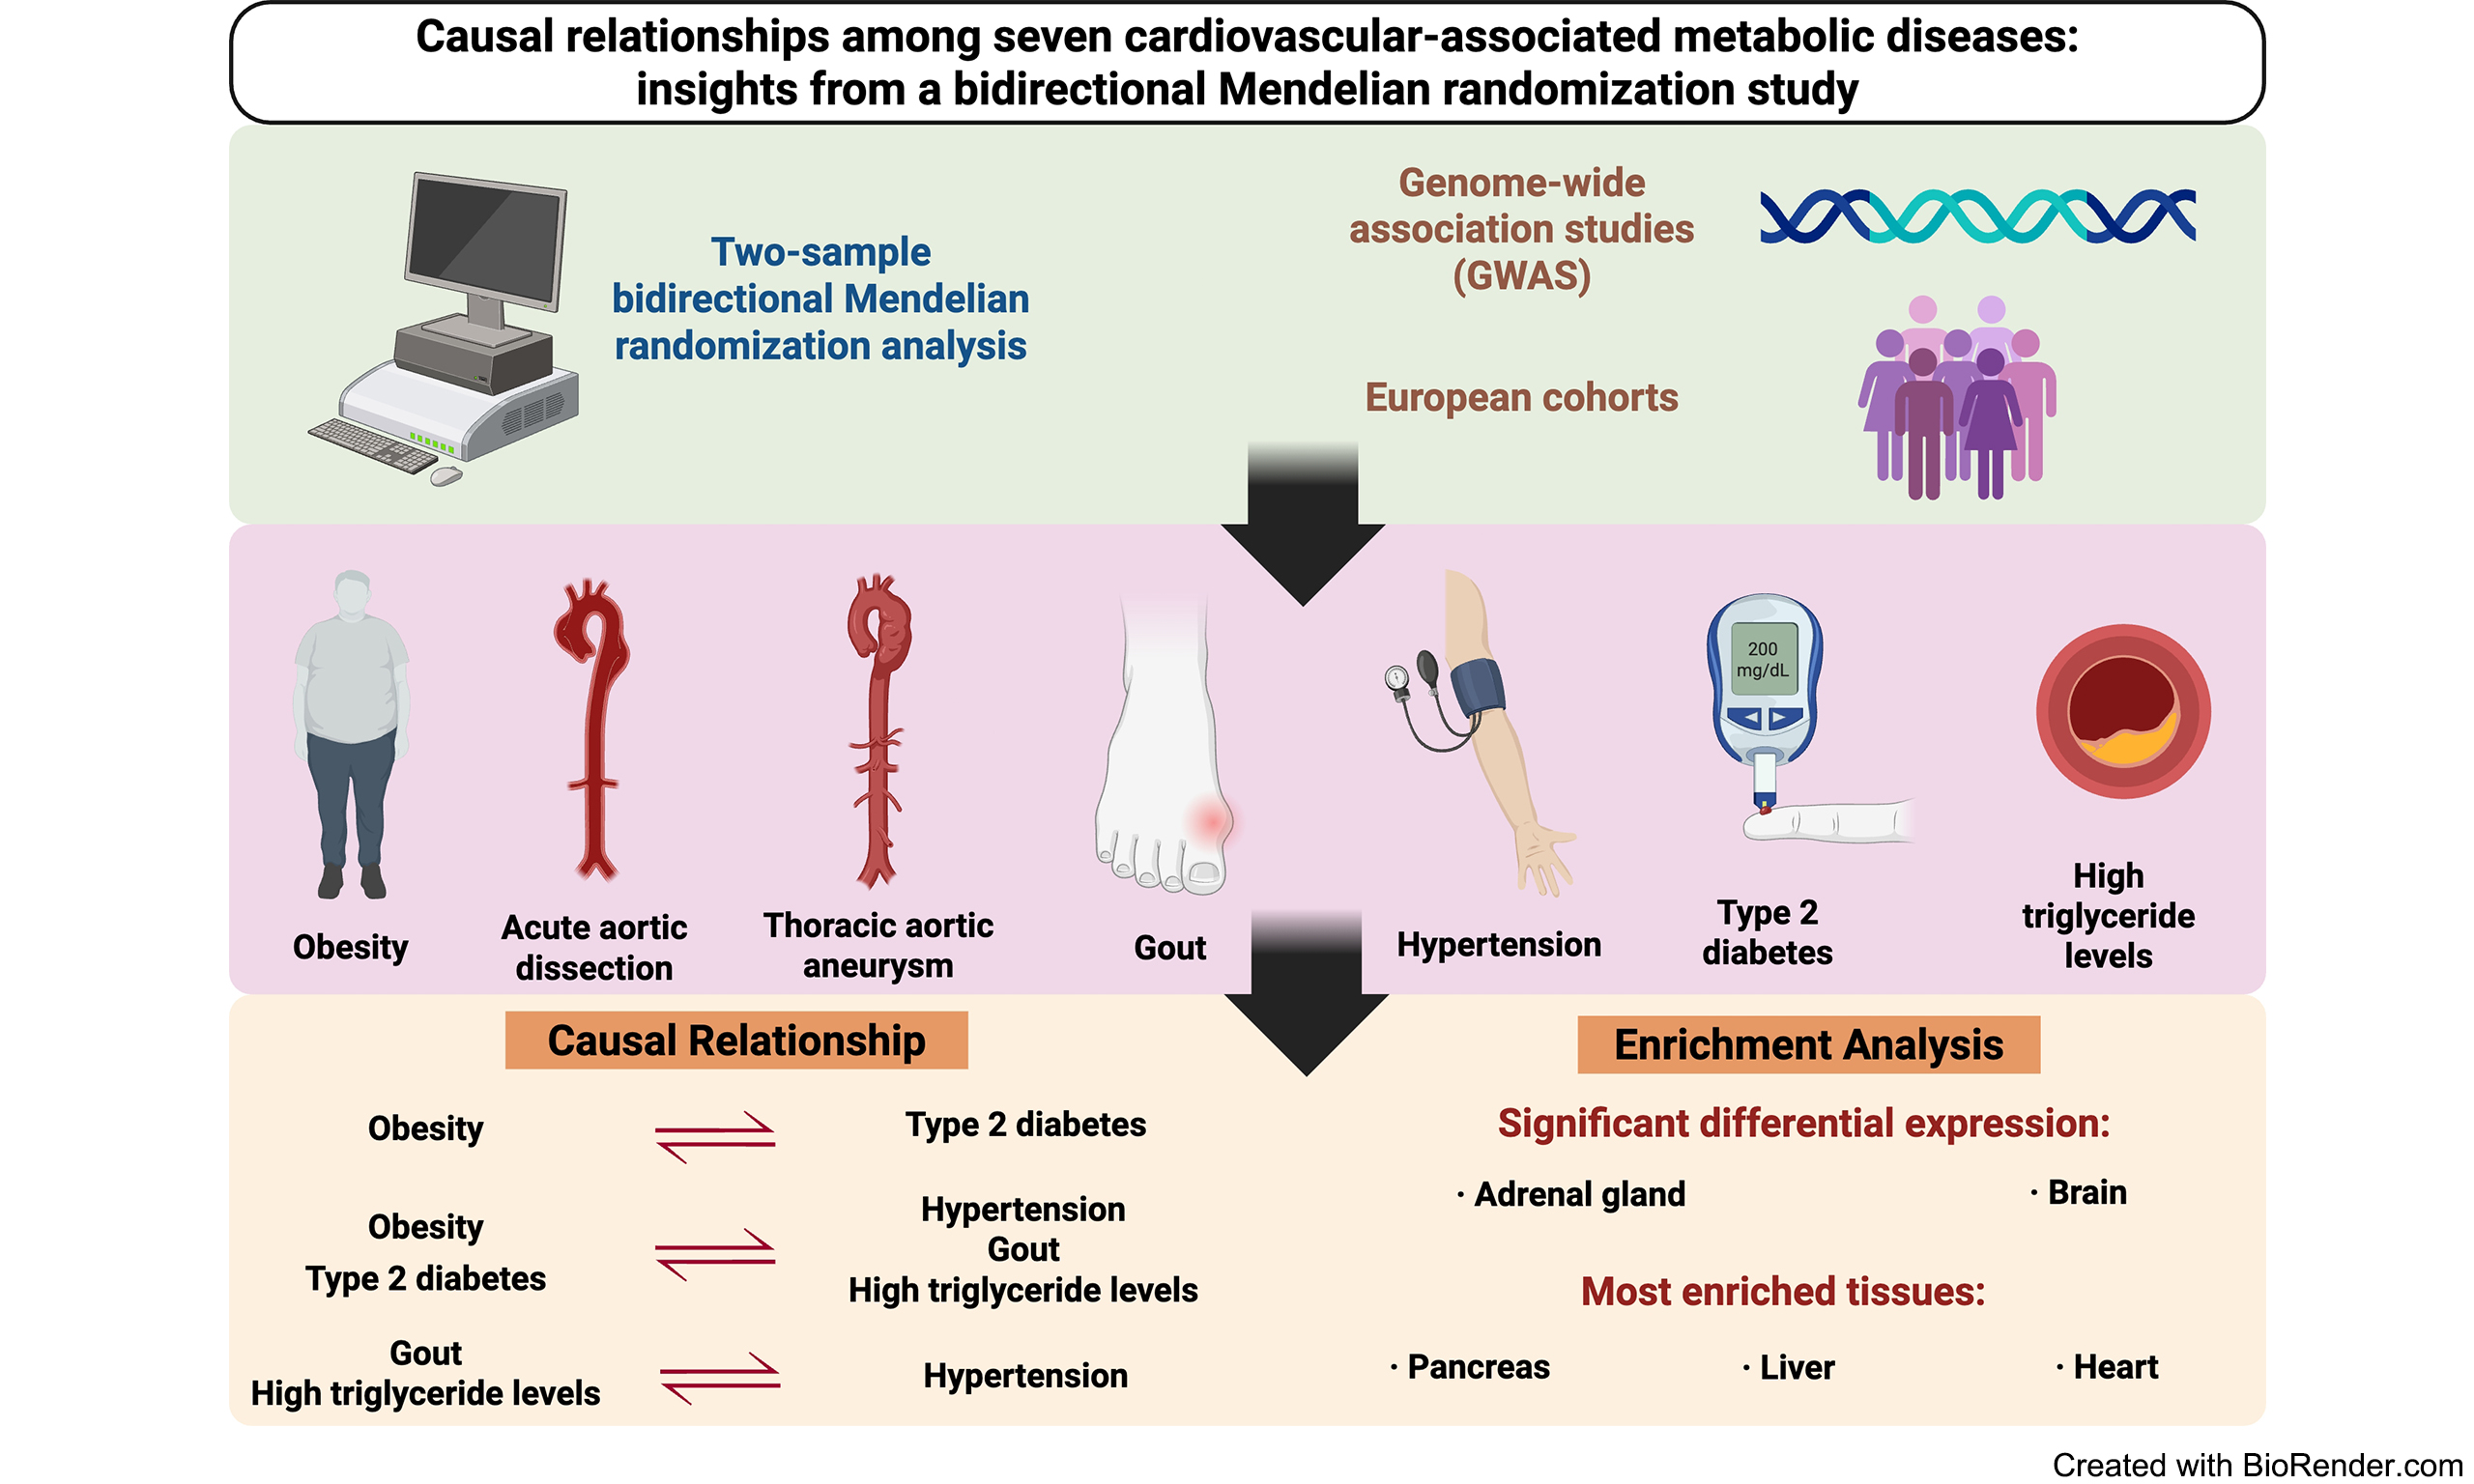
Results: Most metabolic diseases shared common genetic components, and more than sixty percent of paired disorders presented significant positive genetic correlations. The primary MR analysis revealed that obesity causally induced a higher risk of type 2 diabetes (T2D). Both obesity and T2D increased the risk of hypertension, gout, and high triglyceride (TG) levels, whereas gout and TG could pose direct risks for hypertension. Significant differential expression of pleiotropic genes was found in the adrenal gland and brain, and the most enriched tissues were the pancreas, liver, and heart.
Conclusion: This study identified causal relationships among a set of metabolic diseases and indicated potential mechanisms of disease comorbidities. These findings underscore the need for integrative strategies for metabolic disease management and provide insights for future development of targeted medical therapy.
Keywords
INTRODUCTION
The increasing prevalence of metabolic diseases has been a concern worldwide, and the consequent morbidity and mortality rates have remained high for decades[1]. Statistics from the National Health and Nutrition Examination Survey revealed that the prevalence of obesity increased to 33% over the past decades, and a similar trend was observed in childhood[2]. Elevated blood pressure affects more than one billion individuals, and the estimated number of annual deaths has reached 9.4 million[3]. Chronic metabolic abnormalities are universally recognized risk factors for cardiovascular diseases, stroke, and tumors and may lead to multisystem complications during progression[4-7]. Aortic diseases such as dissection and aneurysms could be life-threatening metabolic diseases with a mortality rate of nearly 60% when patients are treated inappropriately[8]. Moreover, although more than one metabolic disease is commonly found in a patient, individuals tend to attach less emphasis and miss the best opportunities for appropriate interventions, which may lead to severe outcomes and economic burdens.
Earlier studies and reviews have indicated that metabolic diseases are closely related to genes and heritability, whereas common variants may explain only part of overall disease risk, and the frequency of disease-risk alleles differs among ethnicities[9-14]. Additionally, there is a genetic correlation between metabolic indices and disorders. For example, pleiotropy-based genetic risk scores have revealed genetic interactions between type 2 diabetes (T2D), body mass index (BMI), and triglyceride (TG) levels[15]. A Swedish Adoption/Twin Study of Aging reported that BMI, insulin levels, triglycerides, lipids and blood pressure were significantly influenced by a single latent genetic factor[16]. However, existing evidence has not fully elucidated the associations among metabolic diseases and their causal relationships from trait to gene level, although genetic variation and pleiotropy suggest disease pathogenesis. Previous studies have been limited in sample size and observational nature, which introduces possible confounding factors and inverse causal relationships between exposures and outcomes, and may lead to heterogeneous results and conclusions.
In this study, we aimed to apply two-sample bidirectional Mendelian randomization (MR) analysis to explore genetic characteristics, including genetic component identification, pleiotropy, and underlying causality among multiple metabolic diseases. A previous MR analysis investigated the genetic relationships among hypothyroidism, T2D, and hypoglycemia, as well as the associated role of the immune system[17]. It mainly focuses on the associations among endocrine metabolic diseases. Instead, our study sheds light on relationships between acute and chronic cardiovascular diseases and systemic metabolic diseases that have not yet been clearly elucidated, including obesity, acute aortic dissection (AAD), thoracic aortic aneurysm (TAA), gout, hypertension, T2D, and high TG levels. This design uncovers pleiotropic pathways linking metabolic dysregulation to cardiovascular complications, addressing a critical knowledge gap in comorbidity mechanisms. Furthermore, combining MR with pleiotropic analysis under the composite null hypothesis (PLACO) and multi-marker analysis of genomic annotation (MAGMA) provides more robust evidence for causal effects. Leveraging genome-wide association studies (GWAS) is crucial for uncovering the genetic architecture and underlying causes of metabolic diseases, which is highly important for early disease prevention, screening, and the development of effective treatment strategies.
METHODS
Study design
We explored the complex genetic relationships among the seven metabolic diseases via linkage disequilibrium score regression (LDSC), identified the corresponding pleiotropic loci and genes via the pleiotropic association analysis method, and evaluated causal associations via the two-sample bidirectional MR approach [Figure 1].
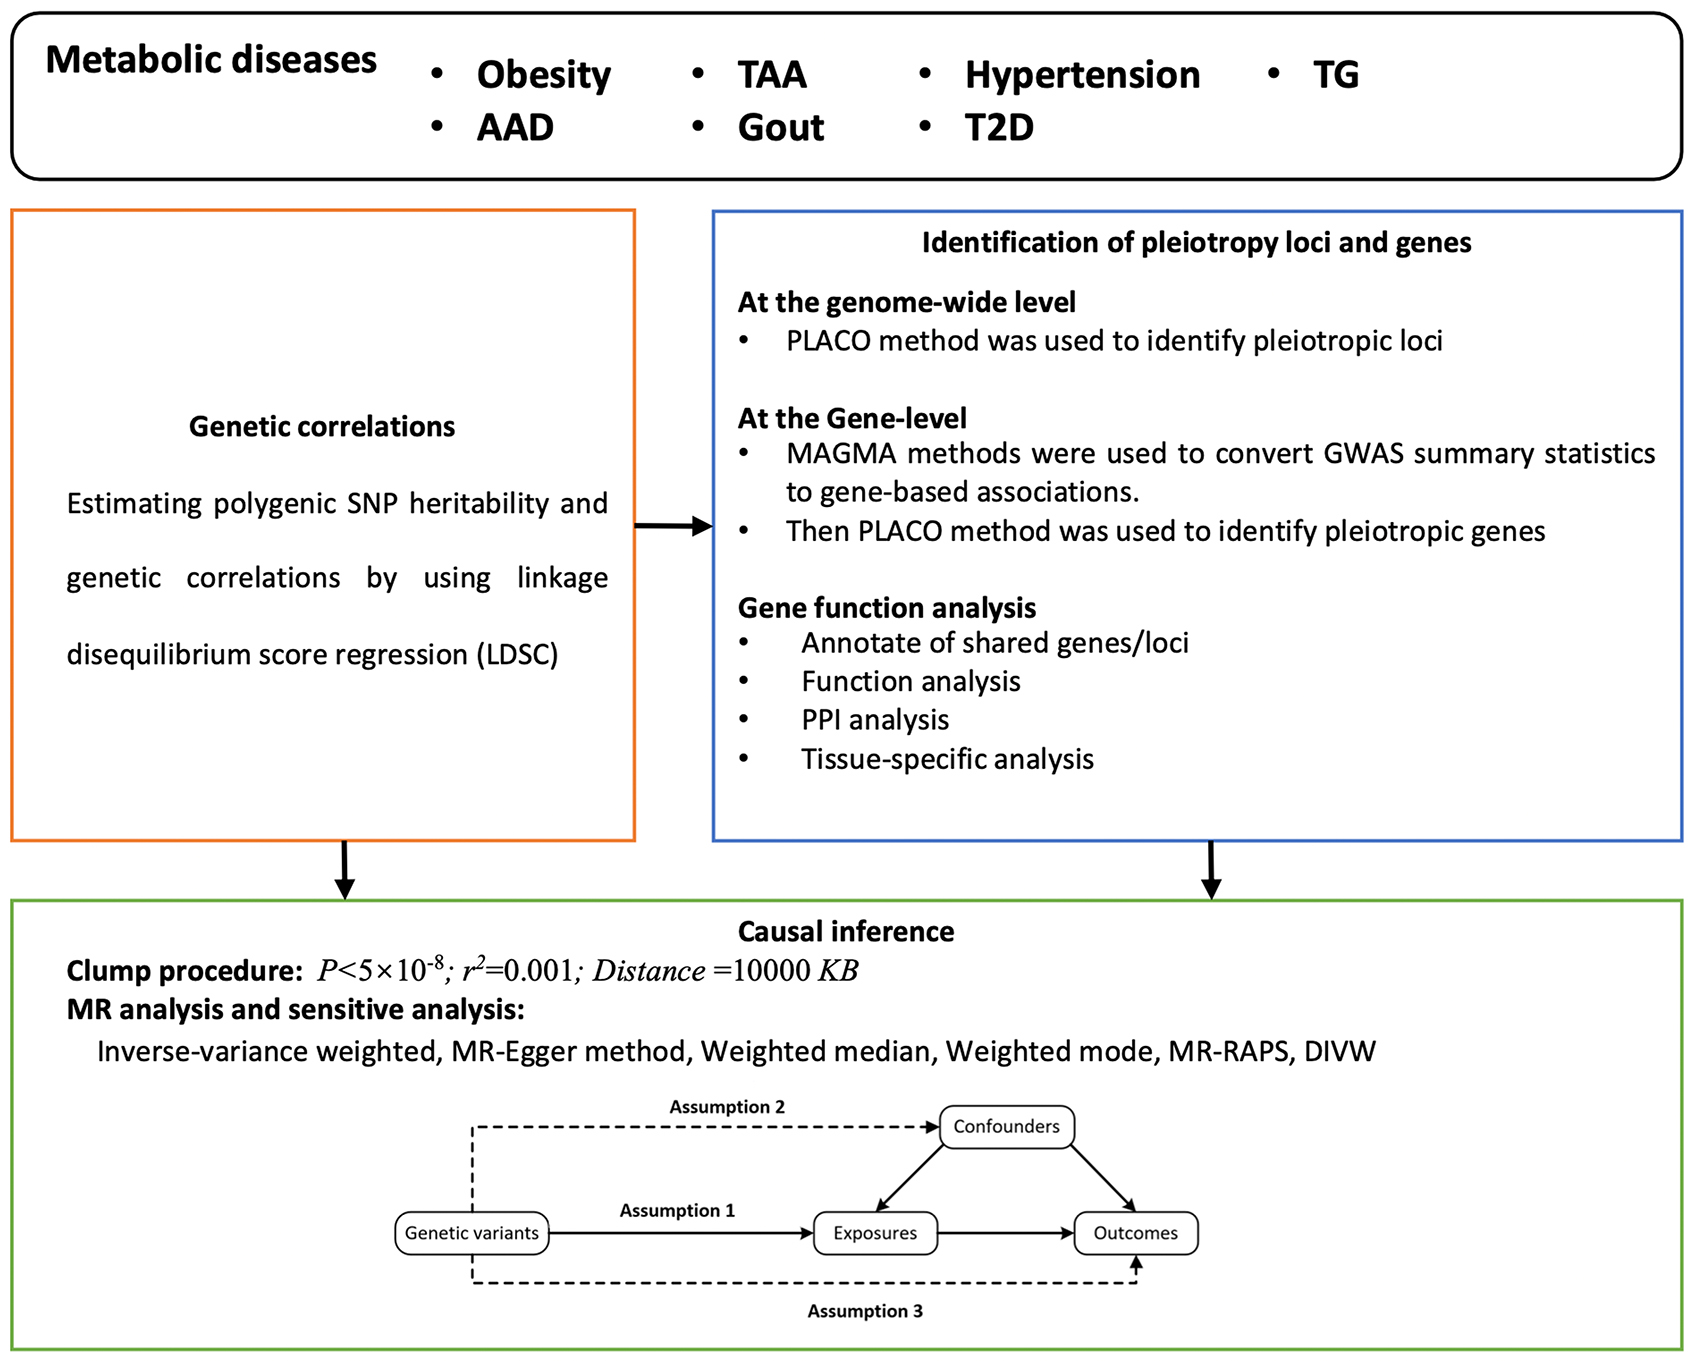
Figure 1. Flowchart of the study. AAD: Acute aortic dissection; DIVW: debiased inverse-variance weighted; GWAS: genome-wide association studies; LDSC: linkage disequilibrium score regression; MR-RAPS: Mendelian randomization-robust adjusted profile score; PLACO: pleiotropic analysis under the composite null hypothesis; PPI: protein-protein interaction; TAA: thoracic aortic aneurysm; TG: triglyceride; T2D: type 2 diabetes.
Data sources for summary statistics
The GWAS summary statistics of seven metabolic diseases were extracted from the GWAS catalog (https://www.ebi.ac.uk/gwas/). The diseases included the following: (1) Obesity: A chronic condition that refers to excess body fat measured by BMI. Obesity increases the risk of heart disease, diabetes, and cancer. (2) AAD: AAD is a serious cardiovascular condition characterized by a tear in the inner layer of the aortic wall, allowing blood to enter and form a false lumen, which can lead to fatal complications. (3) TAA: This potential life-threatening condition involves abnormal swelling or dilation of the aorta, which can lead to rupture or entrapment of the aorta. (4) Gout: A type of inflammatory arthritis that causes acute pain and swelling owing to the accumulation of uric acid crystals in the joints. (5) Hypertension: A common chronic condition that refers to the persistent elevation of arterial blood pressure. Hypertension is an important risk factor for heart disease, stroke, and kidney disease. (6) T2D: A metabolic disorder characterized by elevated blood glucose level, usually owing to insulin resistance and relative insulin hyposecretion. T2D is associated with obesity, diet, and genetic factors. (7) High TG levels: A type of fat found in the bloodstream that the body uses to store energy. High TG levels are a risk factor for heart diseases and other metabolic disorders.
Quality control of the data
For all analyzed diseases, we applied stringent quality control to the European ancestry GWAS summary statistics for the following reasons: (1) Non-biallelic and strand-ambiguous SNPs were excluded to prevent potential strand misalignment and ambiguous genotype interpretation. (2) SNPs lacking rsID annotations were removed to ensure consistent mapping across datasets. (3) Duplicate SNPs and those absent from the 1000 Genomes Project reference, or with mismatched alleles, were omitted to maintain alignment with a widely accepted genetic reference panel. (4) SNPs within the major histocompatibility complex (MHC) region (chr6:28.5–33.5 Mb) were excluded due to their highly complex linkage disequilibrium, which can confound association analyses. (5) We included only SNPs with minor allele frequency (MAF) > 0.01 to focus on common genetic variants and reduce the risk of false positives from rare variants. (6) In addition, since the intestinal and lung disease datasets came from independent sources, the degree of sample overlap between them was low, minimizing potential confounding by shared participants. For each SNP, we retained key information including effect size, standard error, effect allele, and P value for downstream analyses.
Genetic correlation analysis
The analysis was conducted under the standardized analysis procedures of LDSC[18]. It was applied to investigate the shared polygenic structure between traits. The linkage disequilibrium score was calculated according to a sample of European ancestry from the Thousand Genomes Project that served as the reference group[19]. In addition, we performed analyses that did not restrict the LDSC intercept, which could illustrate residual confounding and indicate whether there was potential sample overlap between the two GWAS.
The pleiotropic analysis under the composite null hypothesis
By utilizing only aggregated-level genotype-phenotype association statistics, SNP-level PLACO is a novel analysis that aims to examine pleiotropic loci among complex characteristics[20]. The approach could efficiently identify gene variants that play a role in multiple traits by integrating data from different sources. In this methodology, the calculation of the squares of the Z scores improved efficiency with summary data and exclusion of very high SNPs with Z^2 > 80 minimized false-positive results. To investigate potential correlations among diseases, the correlation matrix of Z scores was estimated. Additionally, the horizontal alpha intersection union test (IUT) was applied to examine the hypothesis of no pleiotropy. The stringent criteria of statistical control improved the reliability of the results, and the identified pleiotropic loci were biologically significant.
Gene-level analysis
We concentrated SNP-level associations on a single gene-level association signal through MAGMA (v.1.07b) before conducting further gene analyses[21]. This analysis focused on only 18,563 protein-coding genes on autosomes. We assigned neighboring SNPs to the same gene by setting an annotation window of ±500 kb. If the window set was narrow, pathogenic loci in linkage disequilibrium with the target gene might be omitted, and it would reduce the power of the test. On the other hand, if the window set was wide, it could introduce irrelevant variants and increase the risk of false positives. Therefore, a window of ±500 kb was chosen as an optimal balance between coverage and specificity, which effectively captures variants within gene regulatory regions and increases the accuracy of gene association signals. Information about gene locations was obtained from the matched Ensembl build (GRCh37) and Europeans in the 1000 Genomes Project (1000G EUR), which provided detailed gene annotations and high-quality genotype data[22,23]. With MAGMA, we integrated the association signals of all SNPs assigned to the same gene to generate association statistics for each gene. This approach enables better genetic identification associated with traits by summarizing the effects of multiple markers. We subsequently used PLACO for pleiotropic biomarker identification, and it helped elucidate the mechanisms by which pleiotropic genes work together in different biological processes. The biological functions of pleiotropic loci were ascertained through functional mapping and annotation using genome-wide association studies (GWAS) and then mapped to closely related genes[24]. Pathway enrichment analyses based on the Molecular Signature Database (MSigDB) were conducted to explore the functions of the mapped genes[25].
MR analysis
We screened and selected all significant loci that were independently associated with metabolic diseases as instrumental variables (IVs) (P value threshold: P < 5 × 10⁻⁸) via the clump program in PLINK software, with the r2 threshold set at 0.001 and the window at 500 kb. In addition, the r2 and F statistics of the IVs were calculated, and the F statistics were calculated as follows:
where r2 denotes the proportion of variance explained by the instrumental variables, n denotes the sample size, and k denotes the number of SNPs. The primary analysis in MR was inverse variance weighting (IVW), and the IVs needed to fulfill three assumptions: (1) IVs were related to exposures; (2) IVs should not be associated with confounders of exposures and outcome associations; and (3) the effects of IVs on outcomes must operate exclusively through exposures. When the assumption was true, IVW was a powerful method; however, if some IVs were not in accordance with the assumption, incorrect results may be obtained. Thus, sensitivity analyses including the Q test from IVW and MR-Egger tests to distinguish potential violated assumptions through heterogeneity of associations across IVs and intercept-based MR-Egger to estimate horizontal pleiotropy were applied. In addition, we used weighted median and weighted mode analyses, which have different modeling assumptions and advantages, to enhance the stability and robustness of the results. The Bonferroni correction was added to determine the significance threshold, and the corrected threshold was 0.05/42 = 0.0012.
All data and MR analyses were performed in R program 3.5.3 (R Core Team, Vienna, Austria) and the MendelianRandomization package.
RESULTS
Seven phenotype-corresponding trials were included and analyzed. The cases and controls were all from European cohorts, with numbers ranging from 967 to 188,577 and 18,295 to 853,816, respectively [Table 1].
General information on the seven metabolic diseases
| Phenotypes | Sample size | Reference |
| Obesity | 138,658 European ancestry cases, 65,840 European ancestry controls | Berndt et al.[26] |
| AAD | 967 European cases, 381,977 European controls | Kurki et al.[27] |
| TAA | 1,351 European ancestry cases, 18,295 European ancestry controls | Roychowdhury et al.[28] |
| Gout | 13,179 European cases, 750,634 European controls | Tin et al.[29] |
| Hypertension | 28,391 European ancestry cases, 28,246 European ancestry controls | Guindo-Martínez et al.[30] |
| T2D | 80,154 European ancestry cases, 853,816 European ancestry controls | Mahajan et al.[31] |
| TG | 188,577 European ancestry individuals | Willer et al.[32] |
Estimated cross-trait genetic correlation
Number of genes and SNPs shared among different metabolic diseases
The pleiotropic connections between paired metabolic disorders were identified via PLACO analysis. We discovered that, except for TAA and hypertension, shared genes were found in most disease pairs (95.2%, 20 out of 21). Additionally, 90.5% (19 out of 21) of the diseases shared SNPs. The most pleiotropic-associated pairs were T2D and high TG levels (168 genes and 60 SNPs), Gout and T2D (58 genes and 45 SNPs), and obesity and T2D (47 genes and 37 SNPs), with moderately high rg coefficients of 0.34, 0.26, and 0.54, respectively [Figure 2]. Additionally, the QQ plots of the PLACO P-values showed no evidence of inflation or systematic bias [Supplementary Figure 1].
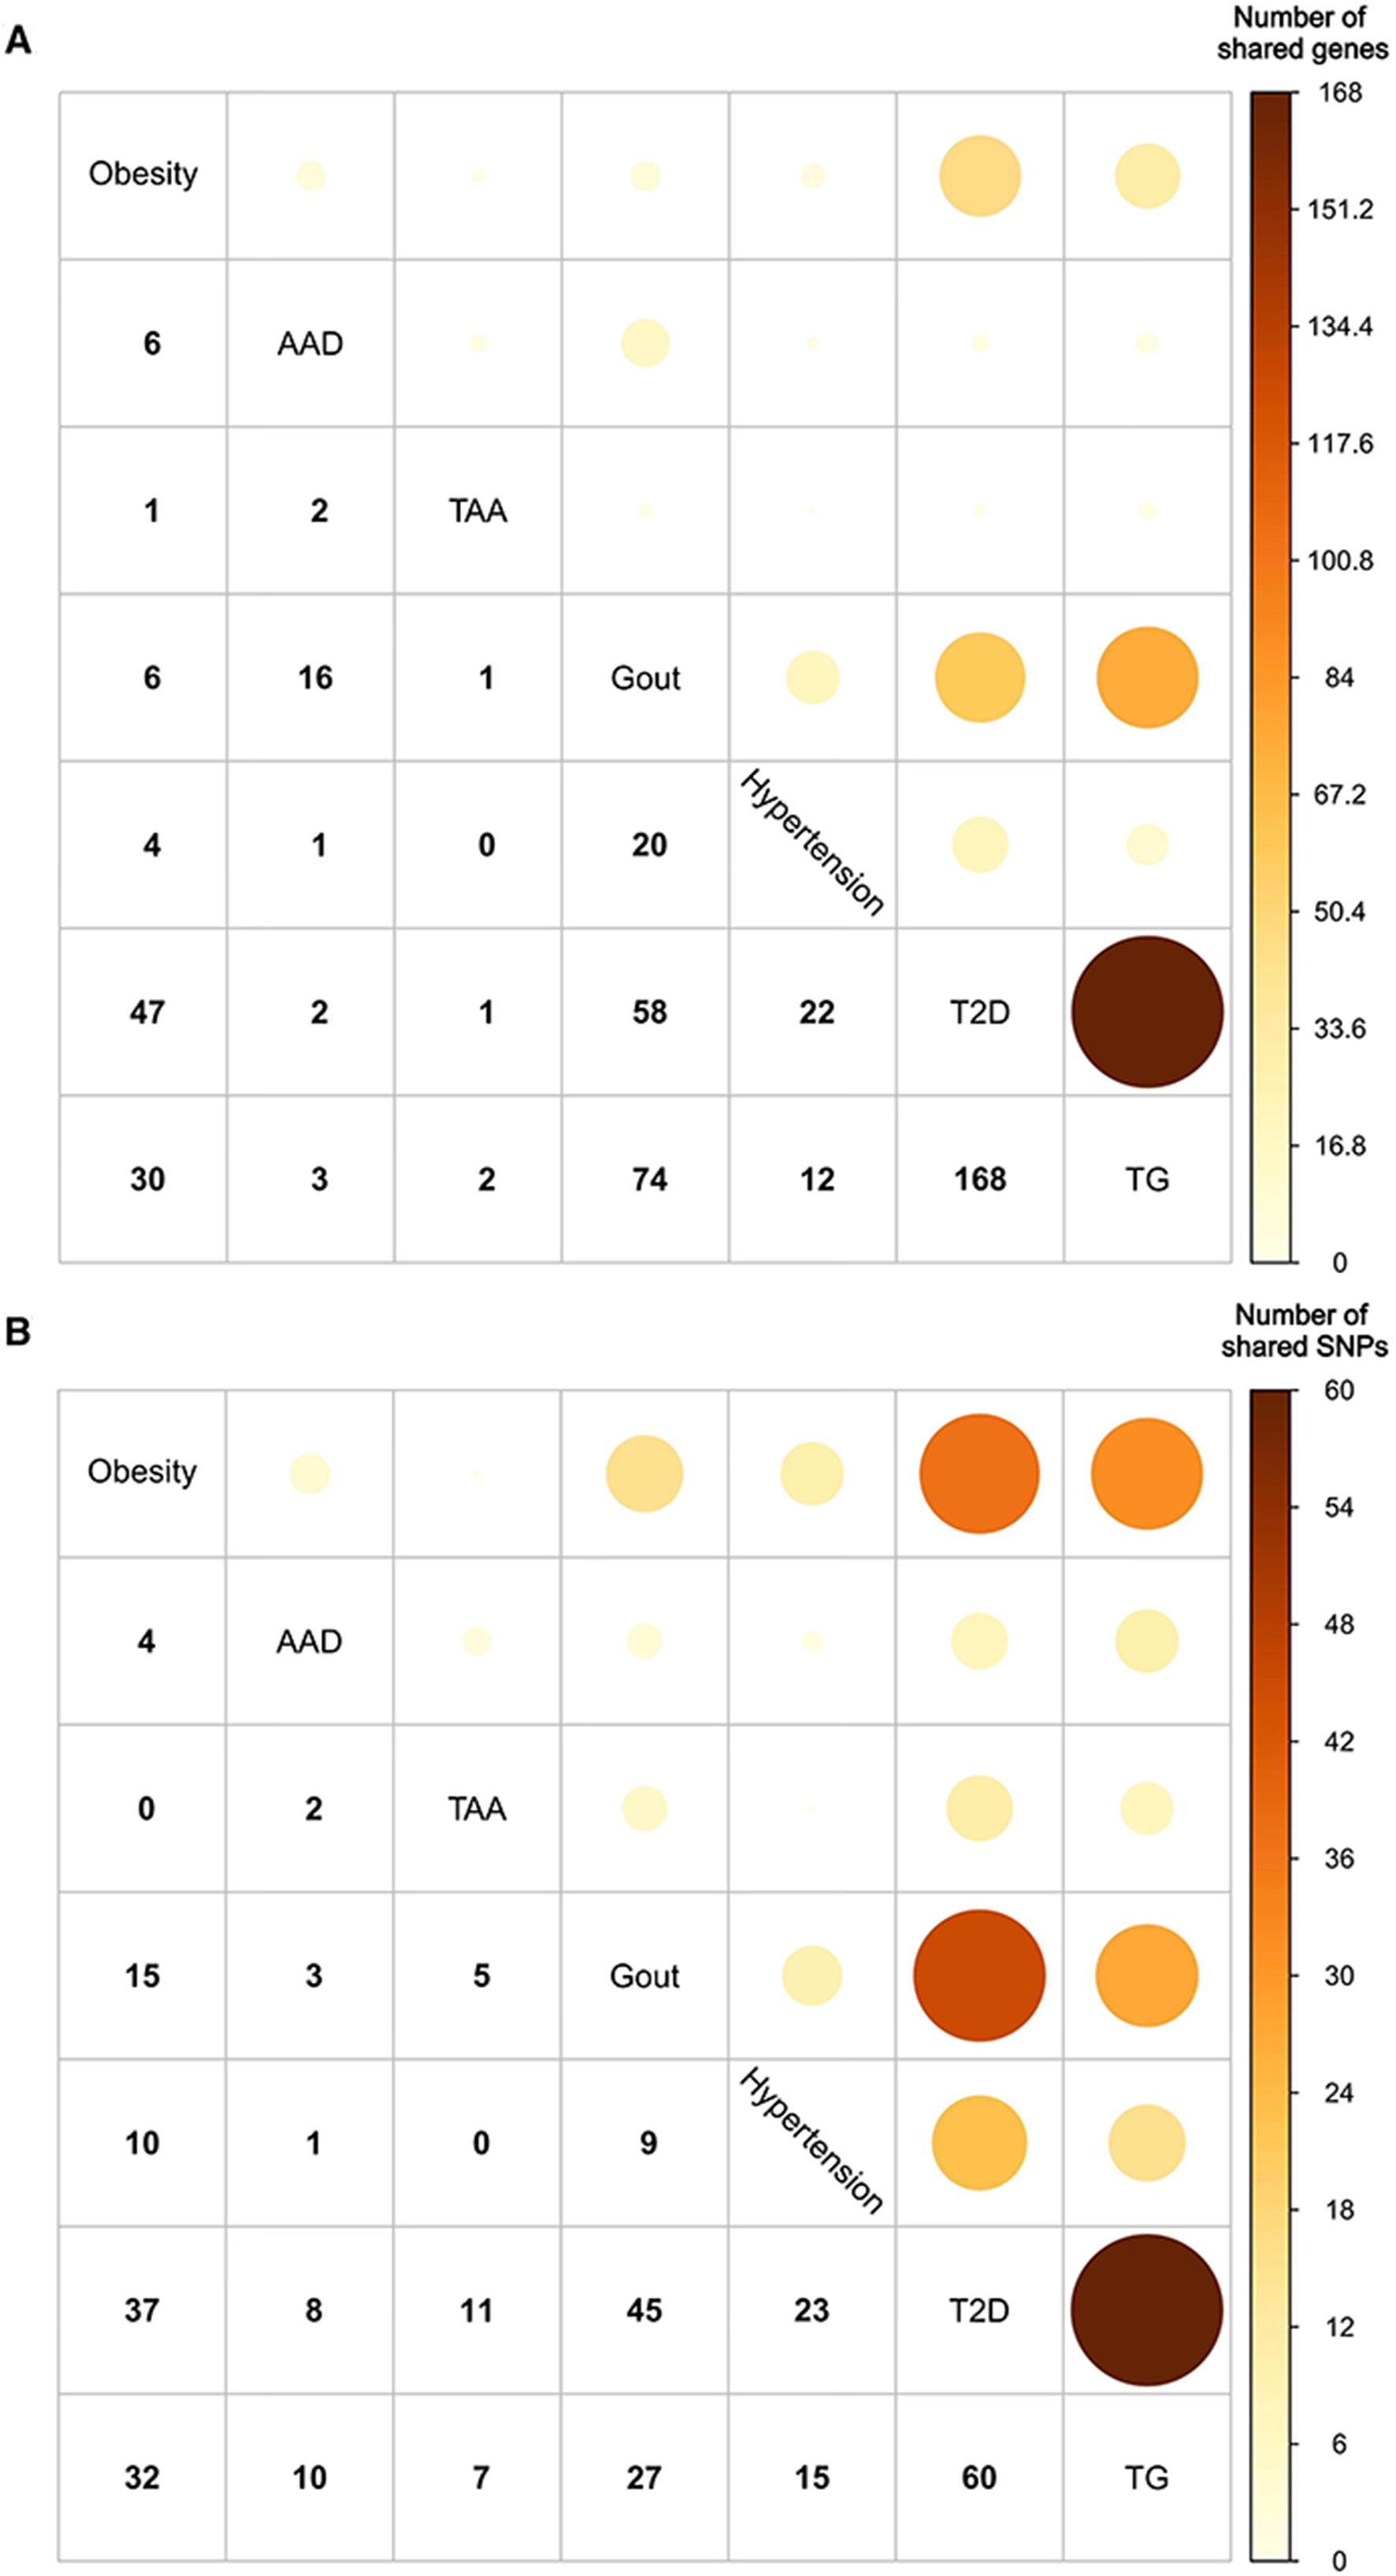
Figure 2. The number of shared (A) genes and (B) SNPs among different metabolic diseases. AAD: Acute aortic dissection; SNPs: single-nucleotide polymorphisms; TAA: thoracic aortic aneurysm; TG: triglyceride; T2D: type 2 diabetes.
Correlation heatmap of metabolic diseases
The genetic correlations in disease pairs analyzed by the LDSC with intercepts were depicted in Figure 3 and Supplementary Table 1. Positive genetic correlations were detected in eighteen out of twenty-one pairs (85.7%). Approximately 61.9% of the pairs had P values < 0.05, and 10 pairs (47.6%) were still positive after the Bonferroni correction. Details of the PLACO in pleiotropic genes and SNP identification among paired diseases are shown in Supplementary Tables 2-5. In the MAGMA gene-based analysis, 125 out of the 336 genes remained positively correlated after Bonferroni correction [Supplementary Table 3].
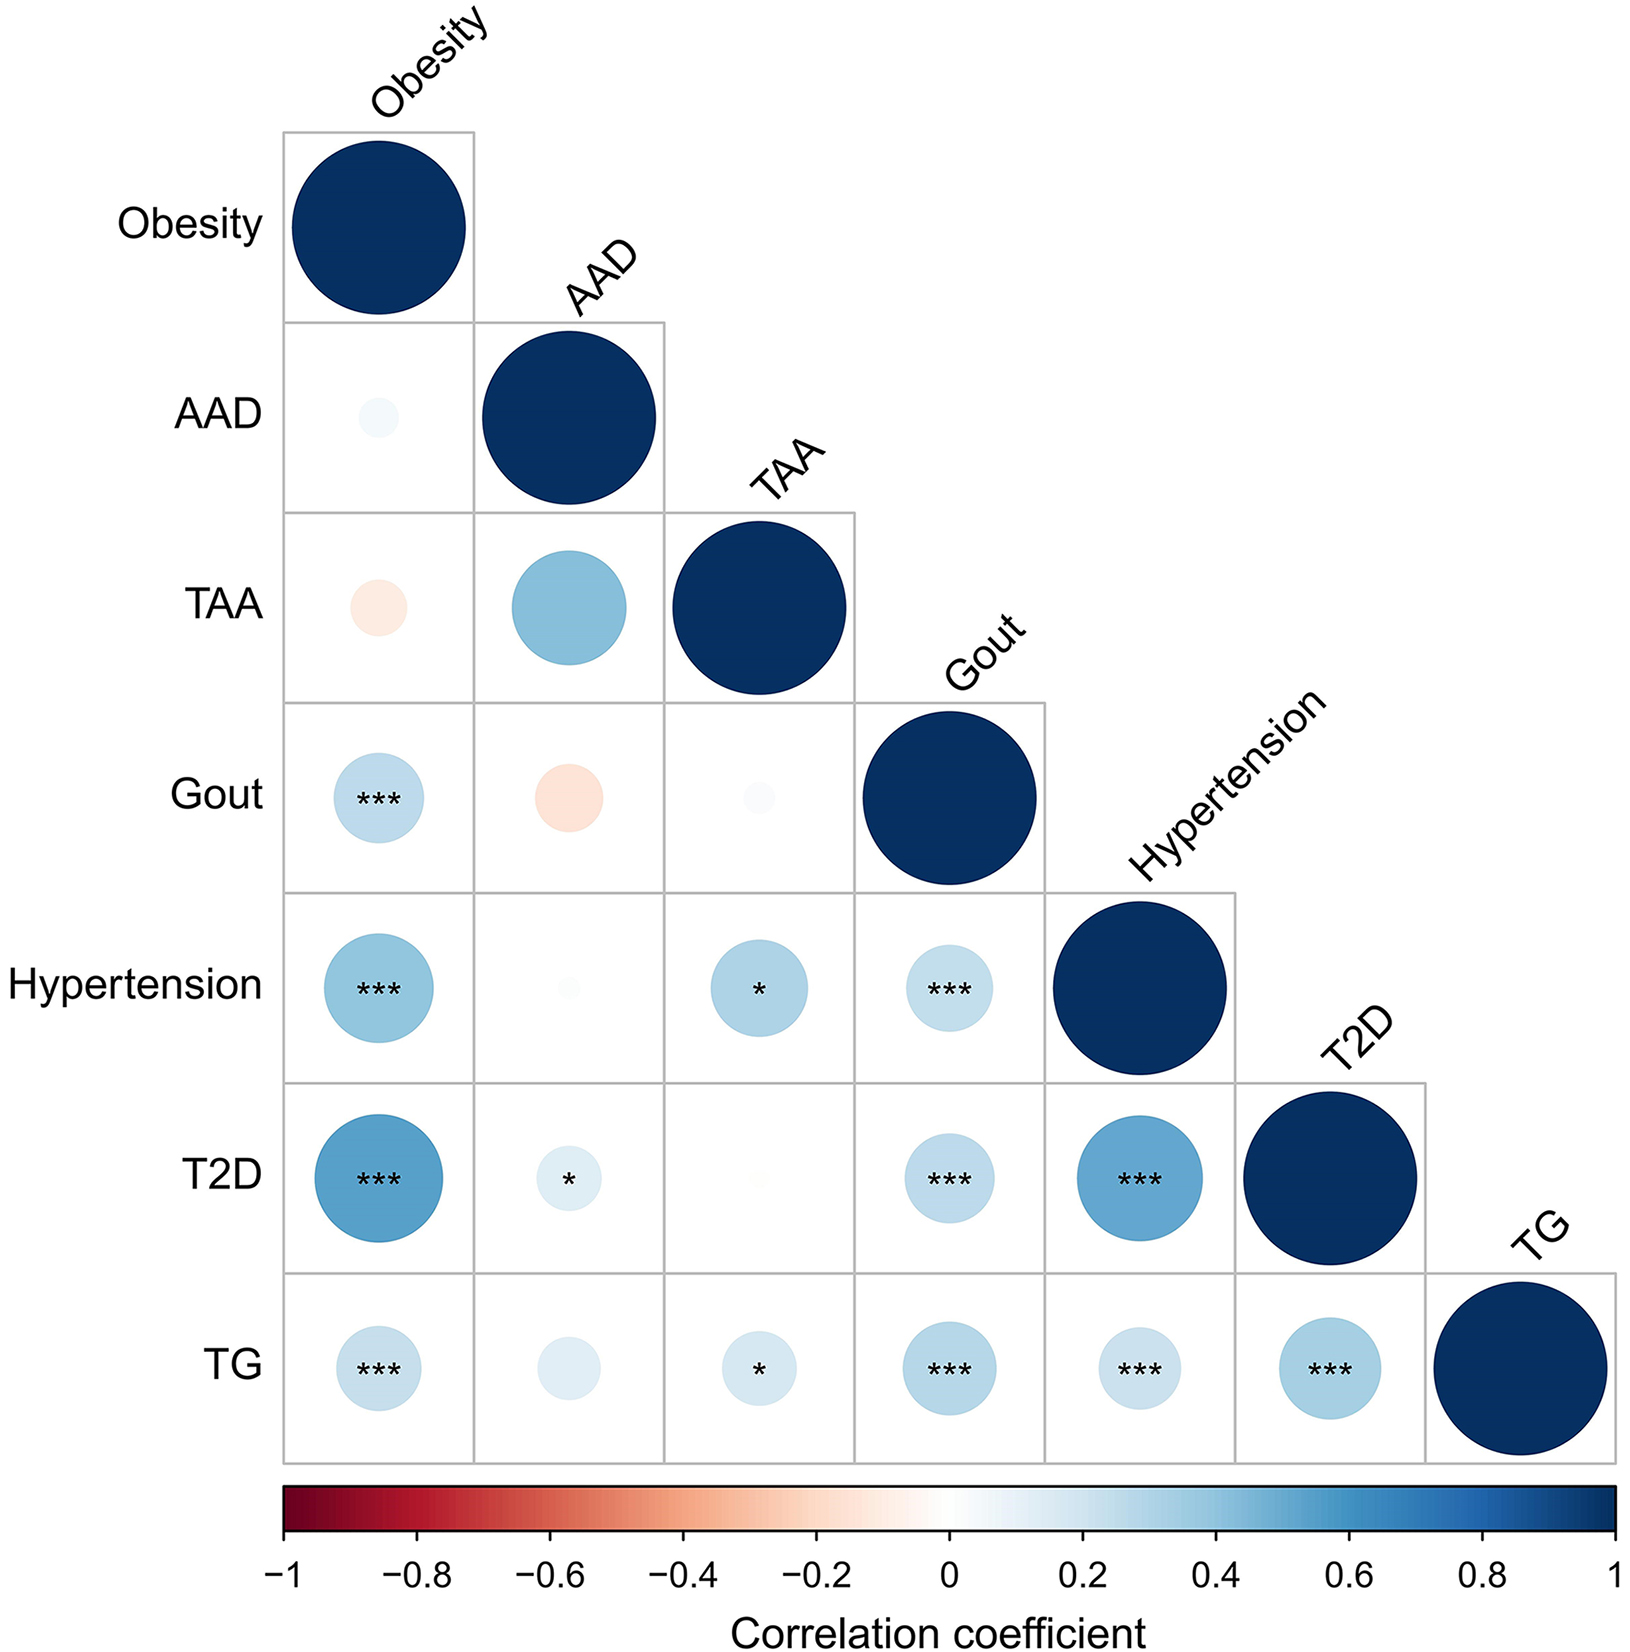
Figure 3. Correlation heatmap of metabolic diseases. AAD: Acute aortic dissection; TAA: thoracic aortic aneurysm; TG: triglyceride; T2D: type 2 diabetes. *P < 0.05; **P < 0.01; ***P < 0.001.
The estimated causal relationships between paired metabolic diseases
In the primary analysis [Figure 4, Supplementary Table 6], obesity predicted by genetics was suggestively causally linked to increased risks of T2D (beta value = 0.392; P < 0.001), high TG levels (beta value = 0.070;
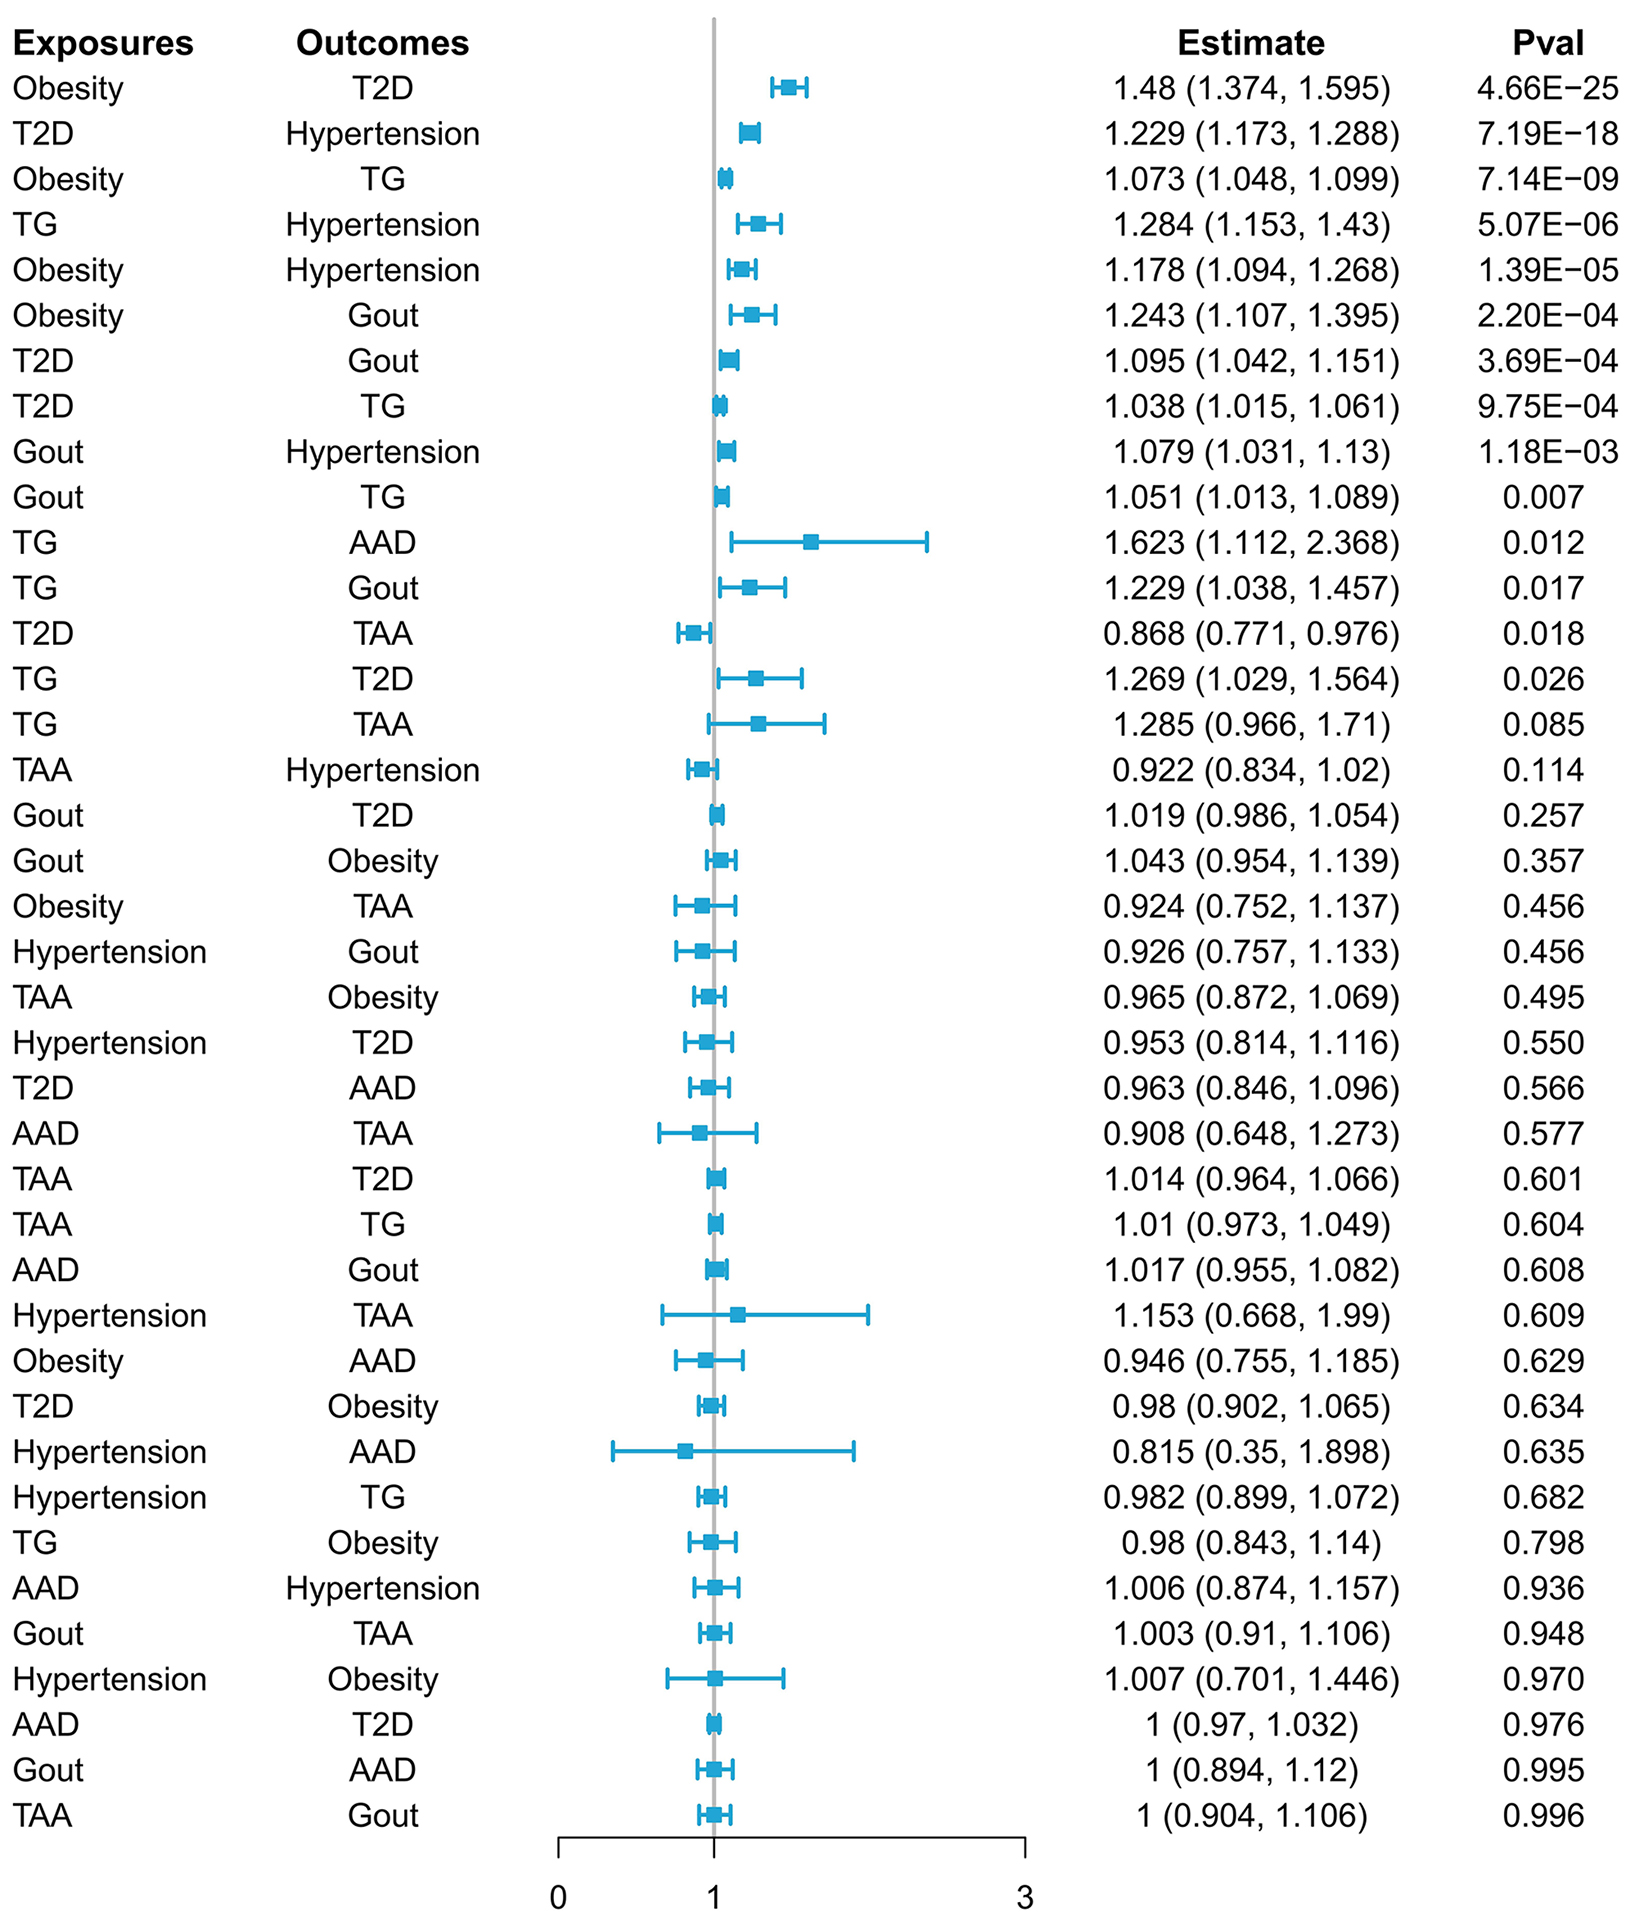
Figure 4. The primary result of the bidirectional Mendelian randomization analysis. AAD: Acute aortic dissection; TAA: thoracic aortic aneurysm; TG: triglyceride; T2D: type 2 diabetes.
The results of the sensitivity analysis are shown in Supplementary Table 7. Comparable outcomes from different methods indicated valid estimations from primary MR analysis and disease causal relationships after Bonferroni correction, with the exceptions of high TG levels and T2D, gout and high TG levels, high TG levels and gout, high TG levels and AAD, and T2D and TAA.
Enrichment analysis among shared genes
Figure 5A displays pleiotropic genes shared among different metabolic diseases. Twenty-six genes were expressed in at least three different diseases, eighteen in at least four different diseases, and four in at least five different diseases individually. The expression distribution and density of pleiotropic genes across the fifty-four GTEx tissues were shown in Figure 5B and Supplementary Table 8. Approximately half of the genes presented increasing expression levels, with the SNRPD2, SNX17, MRPL33, NRBP1, PPM1G, EIF2B4 and RELA genes being the most significantly differentially expressed genes.
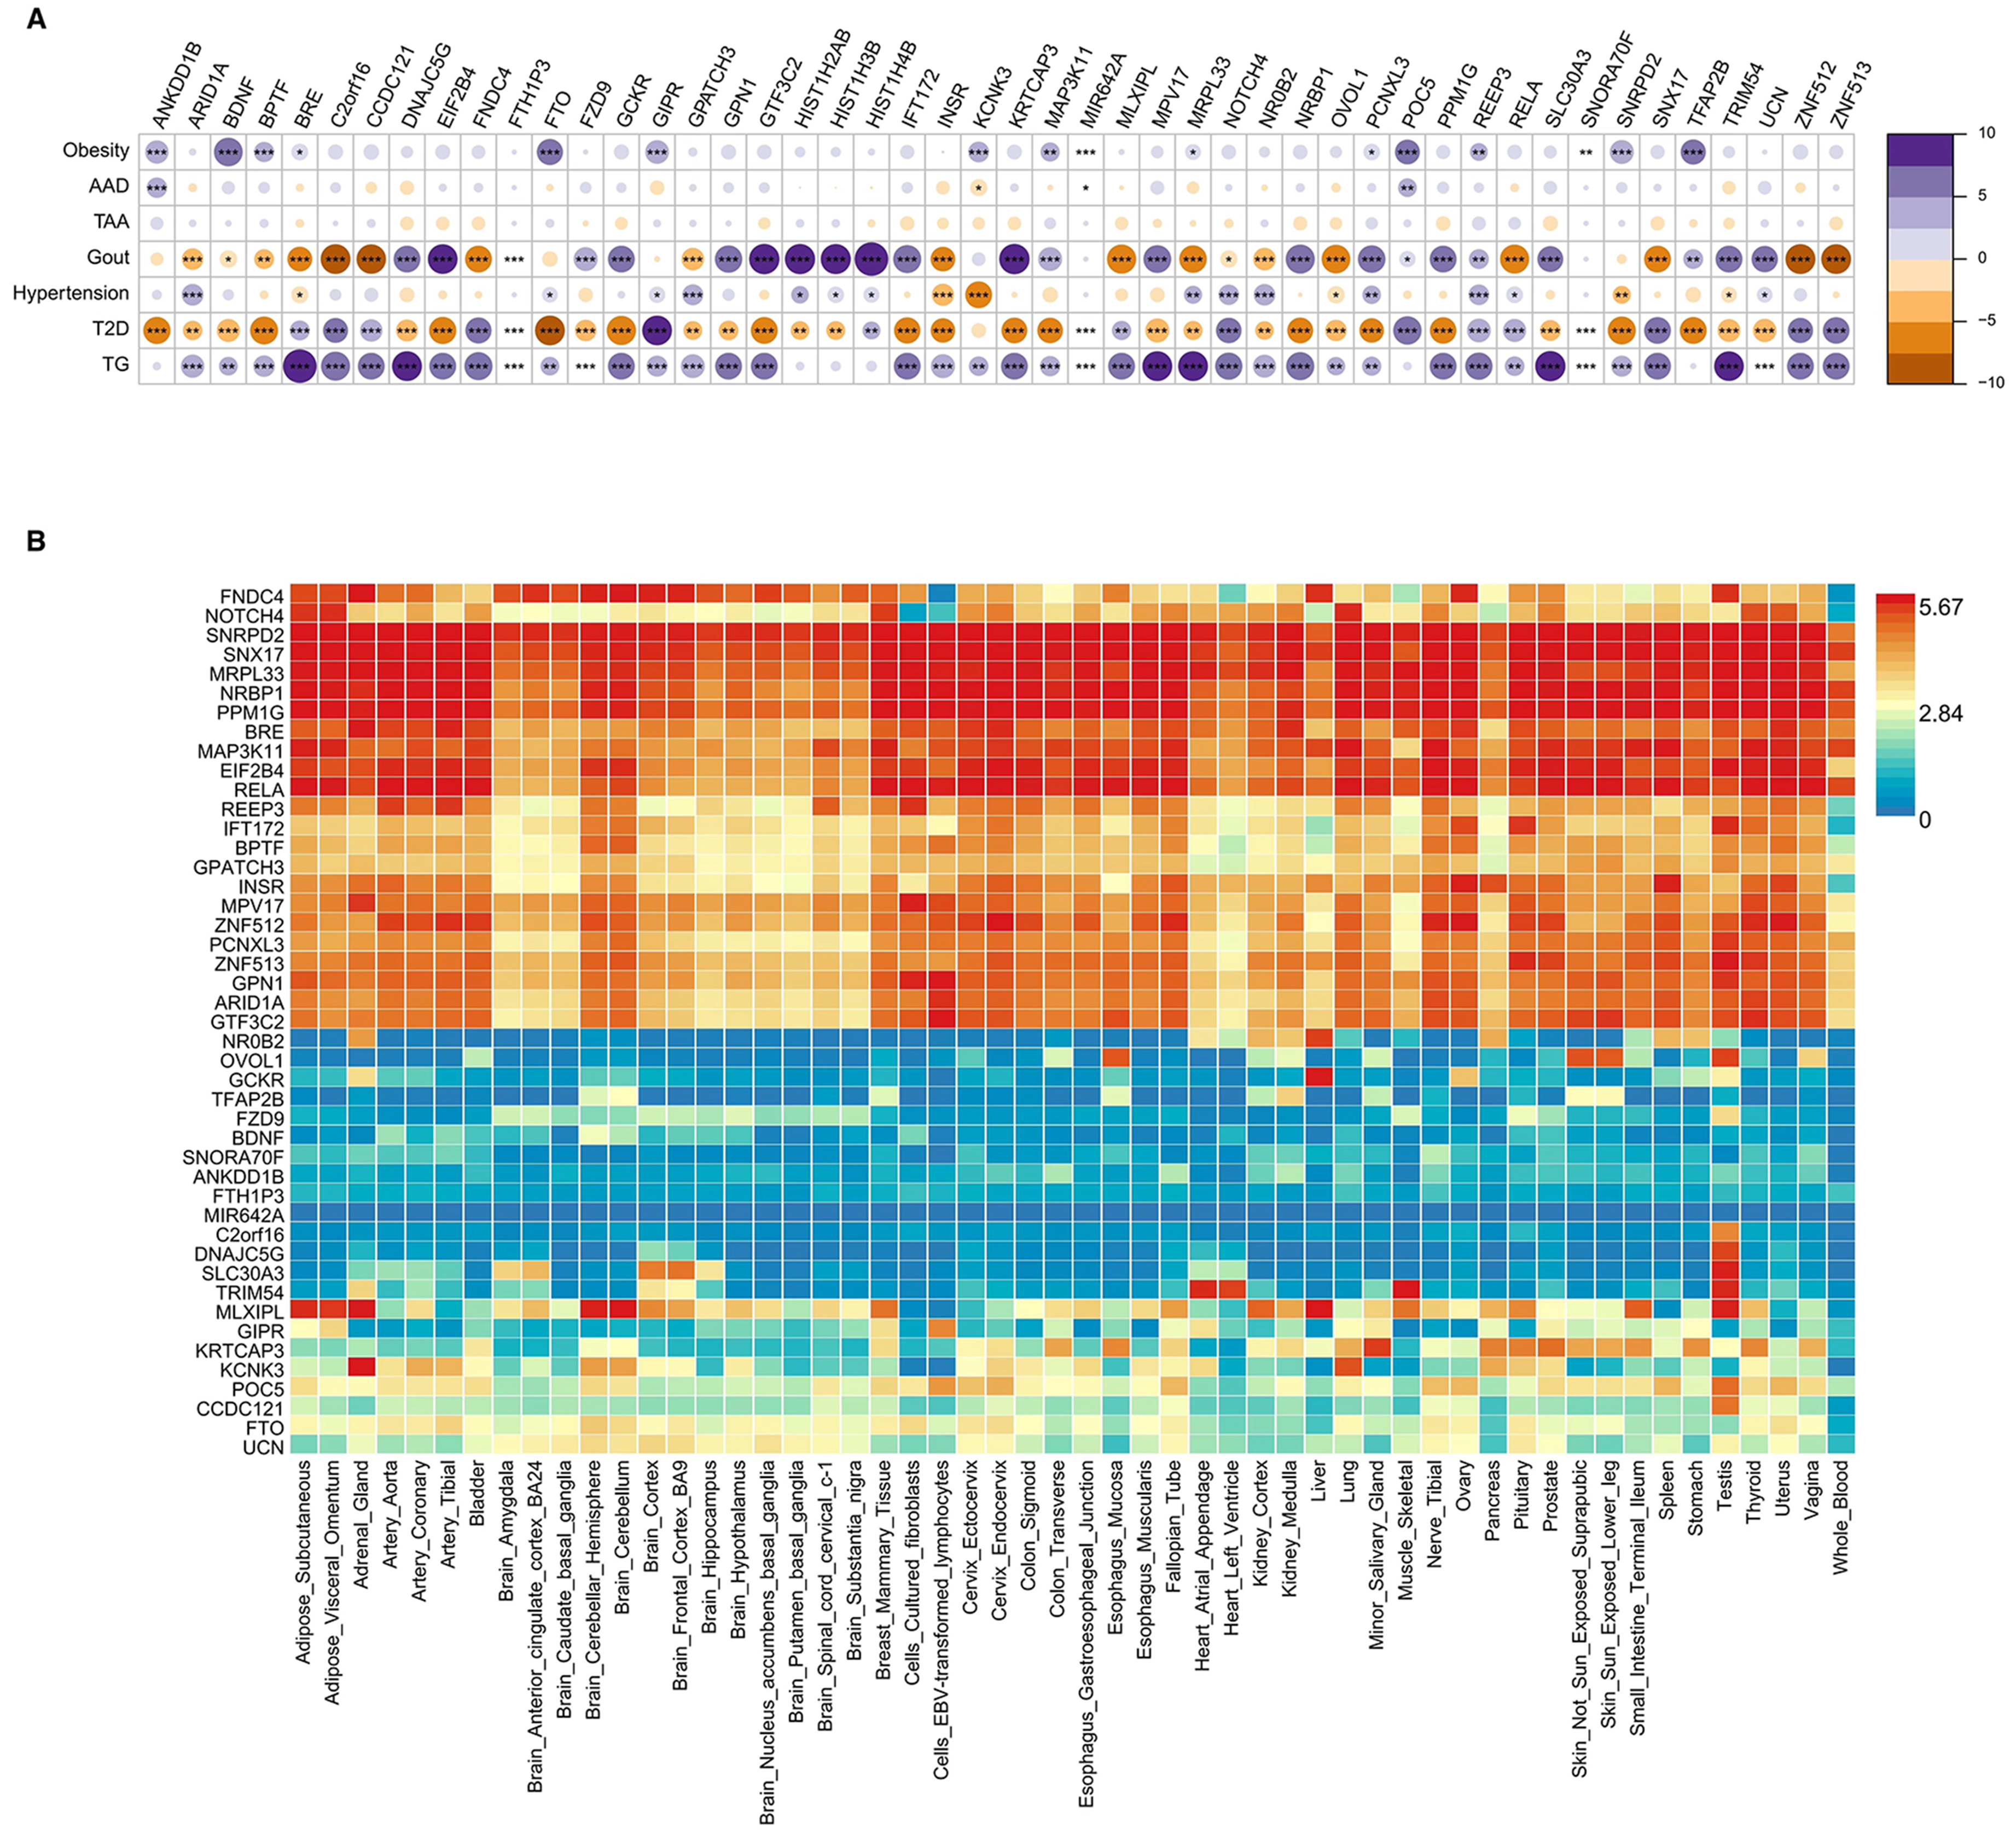
Figure 5. The results of enrichment analysis. (A) Shared pleiotropic genes among metabolic diseases; (B) Distribution of pleiotropic genes in each tissue. AAD: Acute aortic dissection; TAA: thoracic aortic aneurysm; TG: triglyceride; T2D: type 2 diabetes. *P < 0.05;
The results of the gene set enrichment analyses of the identified pleiotropic genes in thirty common GTEx tissues are shown in Supplementary Figure 2. The differential expression levels of some upregulated genes were significantly greater in the adrenal gland (P < 0.001), whereas those of some downregulated ones were significantly greater in the brain (P = 0.038). The genes in both classifications were predominant in the pancreas (P = 0.003), liver (P = 0.01), and heart (P = 0.018). The bar in red represents significant enrichment with Bonferroni adjustment for multiple hypothesis testing.
In addition, we performed Gene Ontology (GO) analysis [Supplementary Figure 3], which revealed significant enrichment in the categories of biological process (BP) and molecular function (MF)
Protein-protein interaction networks and module analysis
The identified genes were loaded into the STRING database website (http://cn.string-db.org/) to construct the protein-protein interaction (PPI) networks [Supplementary Figure 4A]. In addition, molecular complex detection was applied to determine a gene module. The module involving H4C2, H3C2, and H2AC4 was composed of three nodes and edges [Supplementary Figure 4B].
DISCUSSION
In this bidirectional MR study, a gene pleiotropy analysis was thoroughly conducted on seven metabolic diseases using GWAS summary statistics. We find that obesity is significantly associated with a higher probability of T2D. Both obesity and T2D increase the risk of hypertension, gout, and high TG levels, whereas gout and high TG levels can also directly affect the risk of hypertension. These findings imply an intricate interplay in which obesity and T2D can directly or indirectly influence hypertension and obesity may induce a further series of effects after causing T2D. Metabolic phenotypes are heritable traits whose pathogenesis, initiation, and development are closely related to genetics, affecting tissue structures and functions, the immune system, and inflammation[33-39]. Furthermore, at the whole-genome level, our analysis reveals shared genetic components under various metabolic disorders. This is the underlying mechanism of metabolic diseases coexistence, and these disorders may be extreme manifestations of continuous heritable traits[40-42]. Because of the relevant unclear estimations and the limited sample sizes generated for several disorders, it is conceivable that some genetic connections between paired diseases are not significant. However, the application of PLACO and MR analyses facilitates the identification of specific pleiotropic genes and corresponding causal associations for investigating metabolic diseases. Moreover, our study reveals more valid causal relationships between chronic diseases (obesity, gout, hypertension, T2D, and high TG levels) and diseases associated with sudden attacks, such as AAD and TAA, and supports the previous evidence that the former could be risk factors for the latter group of diseases[8].
Earlier studies, although observational, reported partial associations or interactions between several metabolic diseases, focusing on transcription or protein levels and primarily exploring individual SNPs[17,43-48]. Our results further verify biological mechanisms among disease pairs. For obesity-induced hypertension, it is reported that obesity could induce dysregulation of the sympathetic nervous system (SNS) and the renin-angiotensin-aldosterone system (RAAS), which leads to renal tubular sodium reabsorption and water retention[49-51]. For individuals with diabetes attributed to obesity, increased plasma free fatty acid concentrations exert adverse effects on β-cells and decrease insulin sensitivity, potentially mediated by oxidative, mitochondrial, and endoplasmic reticulum stress[52]. A previous MR study reported conflicting results; specifically, T2D was not related to gout, and no significant correlation was found between gout and blood pressure[53]. Considering that our sample sizes of cases and controls are much larger, the inferred estimated associations in our study are more convincing. As reported in previous research, with the foundation of insulin resistance, diabetes-related hypertension could involve multiple mechanisms of inappropriate activation of RAAS and SNS, mitochondrial dysfunction, oxidative stress, inflammation, abnormal release of extracellular vesicles, and so on, which lead to vascular stiffening and elevated blood pressure[54]. It is summarized that uric acid triggers the activation of specific transcription factors (NF-κB or AP-1), which leads to enhanced transcription of innate cytokines in various cell types, generation of vasoconstrictive agents, and a decrease in vasodilating compounds, and consequently contributes to the development of hypertension[55]. To those suffering from hypertriglyceridemia, it damages endothelial function and RAAS, and indirectly induces proinflammatory changes, leading to hypertension[56]. We utilize gene-centric analysis based on sets of SNPs, which is more reliable for demonstrating the relationships among universal metabolic disorders and avoids weak association signals and multiple testing. Moreover, the applications of MAGMA and PLACO enable us to comprehensively analyze and characterize pleiotropic biomarkers at the gene level and provide new perspectives and methodologies for genetic studies of complex traits.
Previous tissue-specific enrichment analysis has revealed that pleiotropic genes associated with some metabolic diseases are predominant in the adrenal gland, lymphocytes, kidney cortex, and spleen[17]. Our study complements the spectrum of metabolic diseases and reveals that pleiotropic genes are enriched in other organs and tissues, particularly the pancreas, liver, and heart. Differences in gene expression between the brain and adrenal glands are detected between sets of downregulated and upregulated genes, which echoes early findings that metabolic imbalance conditions or diseases are related to those in other organs or tissues. Aminotransferases, as liver metabolic biomarkers, are strong predictors of T2D and the overall risk of metabolic diseases[57]. Conversely, blood glucose integrates tissue responses, including those in the liver, muscle and adipose tissue, and builds gene interaction networks[58]. In addition, metabolic syndrome has been proven to exert possible effects on the central nervous system and may present as mild cognitive impairment and Alzheimer’s disease, which implies shared pathophysiological mechanisms between metabolic and brain illnesses[59]. Regarding the pancreas, a pooled analysis of twenty prospective cohort studies revealed that BMI was significantly correlated with increased pancreatic cancer mortality and that the risk further increased in overweight and obese patients[60]. Obesity, hypertriglyceridemia and hyperglycemia are recognized as cardiometabolic risk factors and closely linked to impaired cardiovascular health[61-64]. Growing risk of T2D could impose the risk of cardiovascular and aortic artery diseases as well as the development of chronic kidney disease, and these comorbidities could lead to cardiovascular events and even mortality[65]. Therefore, the above organs and disorders are highly related to metabolism, suggesting that metabolic diseases have complex interactions with other systems.
In addition, the results of enrichment analysis are consistent with the MR results. Enrichment in the pancreas can explain the shared genetic basis of obesity, T2D, and high TG. The pancreas serves as the central hub for insulin secretion and glucose metabolism regulation. Genetic dysregulation can lead to cellular dysfunction, cause metabolic disorders, and further promote hypertriglyceridemia and insulin resistance. The liver is the convergence point for lipid, uric acid, and glucose metabolism. This metabolic convergence in the liver elucidates the molecular basis for the comorbidity of metabolic syndrome components and consequent negative effects on the cardiovascular system, such as hypertension. The heart, as one of the key factors in the causal relationship network, may activate the neuroendocrine system when cardiac function is abnormal and thereby further exacerbate hypertension.
On the basis of the above comprehensive genetic analysis, our findings have methodological and clinical implications. The application of a pleiotropic association analysis approach helps elucidate the genetic overlap among disorders and the shared pleiotropic genes underlying tissues and organs, whereas traditional single-SNP studies fail to achieve this overlap. In terms of diagnosis, the identified relationships between genes and certain conditions can be used for early disease screening. For example, specific gene markers or multi-gene risk scores can be incorporated or built in combination with routine diagnostic panels and traditional indices to detect the risk of developing related diseases at an earlier stage. The results update interpretations of the physical and pathological mechanisms of metabolic diseases, which promotes further research and development of new targeted therapies based on the identified genes and the establishment of patient-oriented treatment strategies. Based on discoveries from the analyses, it is advisable to develop drugs targeting identified pleiotropic genes or related molecules to modulate the activities of these cross-disease genes and intervene in the cascade reactions of relevant tissues and organs, which can simultaneously block multiple causal pathways and achieve prevention and control of cardiac-metabolic comorbidities. Moreover, the explored causal relationships in paired metabolic diseases and genome correlations among tissues remind us that in the process of clinical diagnosis and treatment, it is reasonable to evaluate potential risks of underlying connected diseases and raise awareness of disease prevention. If comorbidities appear, intensive treatment and dynamic monitoring need to be considered to prevent mutual progression and deterioration of the prognosis.
Compared with previous observational and small-sample studies, this pleiotropic-gene-based MR study avoids confounding and reverse causality, which further improves the validity of the analysis. Some limitations should be noted. The examined samples are primarily based on genetic datasets from European populations, and the generalizability of the results to other populations requires further validation. Given the differences in genetic backgrounds and environmental influences across populations, future studies should include multi-ethnic cohorts to assess the cross-population robustness of the identified genetic associations and causal relationships. However, the mere enrollment of the European cohorts improves the reliability of our research and avoids the biases of population heterogeneity. The genetic loci were extracted from a GWAS with a comparatively limited sample size, and some rare variants might not be available. In addition, there was potentially some overlap between diseases, which might cause false-positive results. Future larger-scale studies are suggested for further exploration of the roles of the identified genes and complex interactions between these genes and diseases.
Overall, through two-sample bidirectional MR analysis, this study characterizes complex causal relationships and interactions between various metabolic disorders by exploring the shared genetic profiles, which provides insights into in-depth manifestations of common metabolic diseases and potential mechanisms of disease comorbidities. These valuable discoveries indicate that future optimization of precise preventive and therapeutic clinical strategies and improvements in targeted drug development are needed.
DECLARATIONS
Acknowledgments
The authors drew the graphic abstract on the Biorender (https://BioRender.com).
Authors’ contributions
Conceptualization and supervision: Lai Z, Li X, Liu Z
Writing - original draft: Lai Z, Liu Z, Wang X
Investigation: Lai Z, Fan X, Li X
Methodology and data curation: Liu Z, Yang Y, Jiang X
Writing - review and editing: Li X, Shi Y
Funding acquisition: Li X
All the authors read and approved the final manuscript.
Availability of data and materials
The GWAS summary data in this study are derived from public databases, and relevant analyses of the data during the current study are available from the corresponding author upon reasonable request.
Financial support and sponsorship
This work was supported by the Special Research Fund for Central Universities, Peking Union Medical College (Grant No. 3332023022).
Conflicts of interest
The authors declared that there are no conflicts of interest.
Ethical approval and consent to participate
This study used publicly available and de-identified GWAS summary statistics from the GWAS Catalog (https://www.ebi.ac.uk/gwas/). No ethical approval was required.
Consent for publication
Not applicable.
Copyright
© The Author(s) 2025.
Supplementary Materials
REFERENCES
1. Chew NWS, Ng CH, Tan DJH, et al. The global burden of metabolic disease: data from 2000 to 2019. Cell Metab. 2023;35:414-428.e3.
2. Grunvald E, Shah R, Hernaez R, et al; AGA Clinical Guidelines Committee. AGA clinical practice guideline on pharmacological interventions for adults with obesity. Gastroenterology. 2022;163:1198-225.
3. Ettehad D, Emdin CA, Kiran A, et al. Blood pressure lowering for prevention of cardiovascular disease and death: a systematic review and meta-analysis. Lancet. 2016;387:957-67.
4. Diabetes Association Professional Practice Committee. 4. Comprehensive medical evaluation and assessment of comorbidities: standards of care in diabetes-2024. Diabetes Care. 2024;47:S52-76.
5. Grundy SM, Stone NJ, Bailey AL, et al. 2018 AHA/ACC/AACVPR/AAPA/ABC/ACPM/ADA/AGS/APhA/ASPC/NLA/PCNA guideline on the management of blood cholesterol: a report of the American College of Cardiology/American Heart Association Task Force on clinical practice guidelines. Circulation. 2019;139:e1082-143.
6. McEvoy JW, McCarthy CP, Bruno RM, et al; ESC Scientific Document Group. 2024 ESC guidelines for the management of elevated blood pressure and hypertension. Eur Heart J. 2024;45:3912-4018.
7. Kleindorfer DO, Towfighi A, Chaturvedi S, et al. 2021 guideline for the prevention of stroke in patients with stroke and transient ischemic attack: a guideline from the American Heart Association/American Stroke Association. Stroke. 2021;52:e364-467.
8. Isselbacher EM, Preventza O, Hamilton Black J 3rd, et al; Peer Review Committee Members. 2022 ACC/AHA guideline for the Diagnosis and Management of aortic disease: a report of the American Heart Association/American College of Cardiology Joint Committee on clinical practice guidelines. Circulation. 2022;146:e334-482.
9. Zeng Y, He H, Zhang L, et al. GWA-based pleiotropic analysis identified potential SNPs and genes related to type 2 diabetes and obesity. J Hum Genet. 2021;66:297-306.
10. Shi LJ, Tang X, He J, Shi W. Genetic evidence for a causal relationship between hyperlipidemia and type 2 diabetes in mice. Int J Mol Sci. 2022;23:6184.
11. King SE, Skinner MK. Epigenetic transgenerational inheritance of obesity susceptibility. Trends Endocrinol Metab. 2020;31:478-94.
12. Pinard A, Jones GT, Milewicz DM. Genetics of thoracic and abdominal aortic diseases. Circ Res. 2019;124:588-606.
14. Stegemann R, Buchner DA. Transgenerational inheritance of metabolic disease. Semin Cell Dev Biol. 2015;43:131-40.
15. Chasman DI, Giulianini F, Demler OV, Udler MS. Pleiotropy-based decomposition of genetic risk scores: association and interaction analysis for type 2 diabetes and CAD. Am J Hum Genet. 2020;106:646-58.
16. Hong Y, Pedersen NL, Brismar K, de Faire U. Genetic and environmental architecture of the features of the insulin-resistance syndrome. Am J Hum Genet. 1997;60:143-52.
17. Shen J, Pan J, Yu G, et al. Genetic interactions and pleiotropy in metabolic diseases: insights from a comprehensive GWAS analysis. J Cell Mol Med. 2024;28:e70045.
18. Bulik-Sullivan BK, Loh PR, Finucane HK, et al; Schizophrenia Working Group of the Psychiatric Genomics Consortium. LD Score regression distinguishes confounding from polygenicity in genome-wide association studies. Nat Genet. 2015;47:291-5.
19. Auton A, Brooks LD, Durbin RM, et al; 1000 Genomes Project Consortium. A global reference for human genetic variation. Nature. 2015;526:68-74.
20. Ray D, Chatterjee N. A powerful method for pleiotropic analysis under composite null hypothesis identifies novel shared loci between type 2 diabetes and prostate cancer. PLoS Genet. 2020;16:e1009218.
21. Leeuw CA, Mooij JM, Heskes T, Posthuma D. MAGMA: generalized gene-set analysis of GWAS data. PLoS Comput Biol. 2015;11:e1004219.
23. Sudmant PH, Rausch T, Gardner EJ, et al; 1000 Genomes Project Consortium. An integrated map of structural variation in 2,504 human genomes. Nature. 2015;526:75-81.
24. Watanabe K, Taskesen E, van Bochoven A, Posthuma D. Functional mapping and annotation of genetic associations with FUMA. Nat Commun. 2017;8:1826.
25. Subramanian A, Tamayo P, Mootha VK, et al. Gene set enrichment analysis: a knowledge-based approach for interpreting genome-wide expression profiles. Proc Natl Acad Sci U S A. 2005;102:15545-50.
26. Berndt SI, Gustafsson S, Mägi R, et al. Genome-wide meta-analysis identifies 11 new loci for anthropometric traits and provides insights into genetic architecture. Nat Genet. 2013;45:501-12.
27. Kurki MI, Karjalainen J, Palta P, et al; FinnGen. FinnGen provides genetic insights from a well-phenotyped isolated population. Nature. 2023;613:508-18.
28. Roychowdhury T, Lu H, Hornsby WE, et al; VA Million Veteran Program. Regulatory variants in TCF7L2 are associated with thoracic aortic aneurysm. Am J Hum Genet. 2021;108:1578-89.
29. Tin A, Marten J, Halperin Kuhns VL, et al; German Chronic Kidney Disease Study. A. Million Veteran Program. Target genes, variants, tissues and transcriptional pathways influencing human serum urate levels. Nat Genet. 2019;51:1459-74.
30. Guindo-Martínez M, Amela R, Bonàs-Guarch S, et al; FinnGen Consortium. The impact of non-additive genetic associations on age-related complex diseases. Nat Commun. 2021;12:2436.
31. Mahajan A, Spracklen CN, Zhang W, et al; FinnGen. Multi-ancestry genetic study of type 2 diabetes highlights the power of diverse populations for discovery and translation. Nat Genet. 2022;54:560-72.
32. Willer CJ, Schmidt EM, Sengupta S, et al; Global Lipids Genetics Consortium. Discovery and refinement of loci associated with lipid levels. Nat Genet. 2013;45:1274-83.
33. Rohde K, Keller M, la Cour Poulsen L, Blüher M, Kovacs P, Böttcher Y. Genetics and epigenetics in obesity. Metabolism. 2019;92:37-50.
34. Weerakkody R, Ross D, Parry DA, et al; Yale Aortic Institute Data and Repository Team. Targeted genetic analysis in a large cohort of familial and sporadic cases of aneurysm or dissection of the thoracic aorta. Genet Med. 2018;20:1414-22.
35. Song J, Gao N, Chen Z, et al. Shared genetic etiology of vessel diseases: a genome-wide multi-traits association analysis. Thromb Res. 2024;241:109102.
36. Leask MP, Crișan TO, Ji A, Matsuo H, Köttgen A, Merriman TR. The pathogenesis of gout: molecular insights from genetic, epigenomic and transcriptomic studies. Nat Rev Rheumatol. 2024;20:510-23.
37. Mani A. Update in genetic and epigenetic causes of hypertension. Cell Mol Life Sci. 2024;81:201.
38. Fuchsberger C, Flannick J, Teslovich TM, et al. The genetic architecture of type 2 diabetes. Nature. 2016;536:41-7.
39. Scicchitano P, Amati F, Ciccone MM, et al. Hypertriglyceridemia: molecular and genetic landscapes. Int J Mol Sci. 2024;25:6364.
40. Bao Y, Lu P, Wang M, et al. Exploring multimorbidity profiles in middle-aged inpatients: a network-based comparative study of China and the United Kingdom. BMC Med. 2023;21:495.
41. Vora J, Cherney D, Kosiborod MN, et al; CaReMe Global Alliance. Inter-relationships between cardiovascular, renal and metabolic diseases: underlying evidence and implications for integrated interdisciplinary care and management. Diabetes Obes Metab. 2024;26:1567-81.
42. Jia X, Yang Y, Chen Y, et al. Multivariate analysis of genome-wide data to identify potential pleiotropic genes for type 2 diabetes, obesity and coronary artery disease using MetaCCA. Int J Cardiol. 2019;283:144-50.
43. Lopez-Cortes OD, Trujillo-Sánchez F, Sierra-Ruelas E, Martinez-Lopez E, Di Marzo V, Vizmanos B. Association between the FAAH C385A variant (rs324420) and obesity-related traits: a systematic review. Int J Obes (Lond). 2024;48:188-201.
44. Nam Y, Lee DG, Bang S, Kim JH, Kim JH, Shin H. The translational network for metabolic disease - from protein interaction to disease co-occurrence. BMC Bioinformatics. 2019;20:576.
45. Sekar P, Aji AS, Ariyasra U, et al. A novel interaction between a 23-SNP genetic risk score and monounsaturated fatty acid intake on HbA1c levels in southeast Asian women. Nutrients. 2024;16:3022.
46. Matsumura Y, Wei FY, Sakai J. Epitranscriptomics in metabolic disease. Nat Metab. 2023;5:370-84.
47. Kivimäki M, Strandberg T, Pentti J, et al. Body-mass index and risk of obesity-related complex multimorbidity: an observational multicohort study. Lancet Diabetes Endocrinol. 2022;10:253-63.
48. Xi Y, Gao W, Zheng K, et al. The roles of genetic and early-life environmental factors in the association between overweight or obesity and hypertension: a population-based twin study. Front Endocrinol. 2021;12:743962.
49. Grassi G. The sympathetic nervous system in hypertension: roadmap update of a long journey. Am J Hypertens. 2021;34:1247-54.
50. Hall JE, do Carmo JM, da Silva AA, Wang Z, Hall ME. Obesity-induced hypertension: interaction of neurohumoral and renal mechanisms. Circ Res. 2015;116:991-1006.
51. Jia G, Sowers JR, Whaley-Connell AT. Obesity in hypertension: the role of the expanding waistline over the years and insights into the future. Hypertension. 2024;81:687-90.
52. Klein S, Gastaldelli A, Yki-Järvinen H, Scherer PE. Why does obesity cause diabetes? Cell Metab. 2022;34:11-20.
53. Yang Y, Xian W, Wu D, et al. The role of obesity, type 2 diabetes, and metabolic factors in gout: a Mendelian randomization study. Front Endocrinol. 2022;13:917056.
54. Jia G, Sowers JR. Hypertension in diabetes: an update of basic mechanisms and clinical disease. Hypertension. 2021;78:1197-205.
55. Du L, Zong Y, Li H, et al. Hyperuricemia and its related diseases: mechanisms and advances in therapy. Signal Transduct Target Ther. 2024;9:212.
56. Lewis GF, Hegele RA. Effective, disease-modifying, clinical approaches to patients with mild-to-moderate hypertriglyceridaemia. Lancet Diabetes Endocrinol. 2022;10:142-8.
57. Sookoian S, Pirola CJ. Liver enzymes, metabolomics and genome-wide association studies: from systems biology to the personalized medicine. World J Gastroenterol. 2015;21:711-25.
58. Panzeri I, Pospisilik JA. Epigenetic control of variation and stochasticity in metabolic disease. Mol Metab. 2018;14:26-38.
59. Rojas M, Chávez-Castillo M, Pirela D, et al. Metabolic syndrome: is it time to add the central nervous system? Nutrients. 2021;13:2254.
60. Genkinger JM, Kitahara CM, Bernstein L, et al. Central adiposity, obesity during early adulthood, and pancreatic cancer mortality in a pooled analysis of cohort studies. Ann Oncol. 2015;26:2257-66.
61. Gami AS, Witt BJ, Howard DE, et al. Metabolic syndrome and risk of incident cardiovascular events and death: a systematic review and meta-analysis of longitudinal studies. J Am Coll Cardiol. 2007;49:403-14.
62. Nordestgaard BG, Benn M, Schnohr P, Tybjaerg-Hansen A. Nonfasting triglycerides and risk of myocardial infarction, ischemic heart disease, and death in men and women. JAMA. 2007;298:299-308.
63. Karlson BW, Palmer MK, Nicholls SJ, Lundman P, Barter PJ. A VOYAGER meta-analysis of the impact of statin therapy on low-density lipoprotein cholesterol and triglyceride levels in patients with hypertriglyceridemia. Am J Cardiol. 2016;117:1444-8.
64. Rhodes KS, Weintraub M, Marchlewicz EH, Rubenfire M, Brook RD. Medical nutrition therapy is the essential cornerstone for effective treatment of “refractory” severe hypertriglyceridemia regardless of pharmaceutical treatment: evidence from a lipid management program. J Clin Lipidol. 2015;9:559-67.
Cite This Article
How to Cite
Download Citation
Export Citation File:
Type of Import
Tips on Downloading Citation
Citation Manager File Format
Type of Import
Direct Import: When the Direct Import option is selected (the default state), a dialogue box will give you the option to Save or Open the downloaded citation data. Choosing Open will either launch your citation manager or give you a choice of applications with which to use the metadata. The Save option saves the file locally for later use.
Indirect Import: When the Indirect Import option is selected, the metadata is displayed and may be copied and pasted as needed.
About This Article
Copyright

Data & Comments
Data
0


Comments
Comments must be written in English. Spam, offensive content, impersonation, and private information will not be permitted. If any comment is reported and identified as inappropriate content by OAE staff, the comment will be removed without notice. If you have any queries or need any help, please contact us at support@oaepublish.com.