


Life cycle assessment of botanical extracts and implications for nutraceutical sustainability: evidence from the VULCANO case study
 0
0 Abstract
Environmental impacts associated with botanical extracts used in nutraceutical and substance-based medical device formulations remain insufficiently characterized due to fragmented and non-comparable life cycle inventory (LCI) data. This study develops and applies a harmonized cradle-to-gate life cycle assessment (LCA) framework to quantify the environmental impacts of selected botanical extracts using primary industrial data collected from Italian, European, and extra-European suppliers, in accordance with ISO 14040/14044 standards. Across the analyzed extracts, climate change impacts range from 2.59 kg CO2-eq per kg to 3.33 kg CO2-eq per kg, with most values clustered within a relatively narrow interval. Energy- and emission-related indicators show moderate variability across extracts, whereas land use and eutrophication impacts, particularly freshwater eutrophication, exhibit higher variability due to crop-specific agricultural characteristics. Contribution analysis reveals a consistent life-cycle structure across all extracts, with process energy consumption representing the dominant contributor to climate change impacts (67%-84%). Auxiliary materials contribute up to 14% of total impacts, while cultivation contributes from < 0.1% to approximately 9%, and transport remains marginal. Sensitivity analysis confirms that modelling assumptions have a limited influence on the results, with all variations remaining below 5% across impact categories. Product-level validation of three pharmaceutical formulations demonstrates that formulation and packaging choices may outweigh extract-level differences under a functionally equivalent dose. Overall, the study provides robust primary-data-based evidence to support eco-design and emissions accounting in nutraceutical supply chains.
Keywords
INTRODUCTION
Reducing the environmental impacts associated with products and production systems requires, as a preliminary step, a comprehensive and methodologically robust assessment of their current environmental burden. In this context, the Life Cycle Assessment (LCA) methodology represents the most established and scientifically recognized framework for quantifying environmental impacts throughout the entire life cycle of a product or service, from raw material extraction to end-of-life[1,2]. By considering emissions and resource use across multiple environmental compartments, including air, water, and soil, LCA provides a holistic perspective that is essential for identifying environmental hotspots and supporting evidence-based decision-making[3,4]. The methodological foundations of LCA are codified in the International Organization for Standardization (ISO) standards ISO 14040[5] and ISO 14044[6], which establish the principles, requirements, and guidelines for conducting transparent and reproducible assessments.
Despite the widespread adoption of LCA in numerous industrial sectors[7], its systematic application within the nutraceutical and substance-based medical device sectors has been less widespread than in other fields. This is partly due to the limited availability of reliable, up-to-date, and geographically representative Life Cycle Inventory (LCI) data concerning the production of key raw materials, particularly botanical extracts.
A review of the scientific literature on LCA applications in the nutraceutical and substance-based medical device sectors was conducted to assess the current state of knowledge and data availability[1]. This review highlighted that, while several studies address environmental impacts of food and agricultural products, specific and consistent LCI data for botanical extracts used in nutraceutical formulations remain limited and fragmented. The literature search, which included publications up to 2022, yielded only a handful of directly relevant studies, highlighting a significant gap in this field. Schau and Fet (2008) emphasized the persistent lack of LCA data for many food products and botanicals, a challenge that continues to affect the nutraceutical sector[1]. The comprehensive work by Notarnicola et al. (2014) on LCA in the agri-food sector further highlighted the ongoing difficulties in obtaining specific LCI data for many botanical products, including those used in nutraceuticals[2]. For algal extracts, which share some similarities with botanical extracts in terms of production processes, Pérez-López et al. (2014) conducted an LCA on the production of bioactive compounds from Tetraselmis suecica at pilot scale[8]. While this study provides valuable insights, it also indirectly highlights the scarcity of similar analyses for terrestrial plant extracts used in nutraceuticals. Additionally, Pattara et al. (2016) analyzed the carbon footprint of extra virgin olive oil production, comparing different production processes[9]. Although not directly focused on nutraceutical products, this study underscores the importance of considering various extraction methods in LCA studies of plant-derived products. It also emphasizes the need for similar comprehensive analyses in the nutraceutical sector. Together, these studies highlight the need for more comprehensive and standardized LCA research in the nutraceutical sector, particularly concerning botanical extracts and their extraction processes. To the authors’ knowledge, no previous study has developed a harmonized, primary-data-based LCI database for multiple botanical extracts under consistent methodological assumptions and industrial-scale conditions. The scarcity of specific LCI data for botanical extracts used in nutraceuticals represents a significant gap in current knowledge. As a result, companies operating in this sector may face substantial challenges in performing comprehensive environmental assessments, accurately quantifying organizational emissions, and complying with emerging sustainability reporting requirements. This situation not only hampers companies’ sustainability efforts but also limits the sector’s overall progress in reducing its environmental footprint.
These issues became evident for Labomar S.p.A., a leading Italian Contract Development and Manufacturing Organization (CDMO) specialized in the formulation and production of food supplements, medical devices, foods for special medical purposes, and cosmetics. While improving the assessment of environmental impacts associated with its operations and products, Labomar identified uncertainties linked to emission factors for botanical raw materials. Available datasets were often outdated, based on non-comparable technologies or cultivation systems, or lacked geographical relevance - conditions that can affect the accuracy of carbon footprint calculations. The limited availability of consistent data also constrained Labomar’s ability to perform product-level LCAs and to fully integrate environmental criteria into procurement and eco-design strategies.
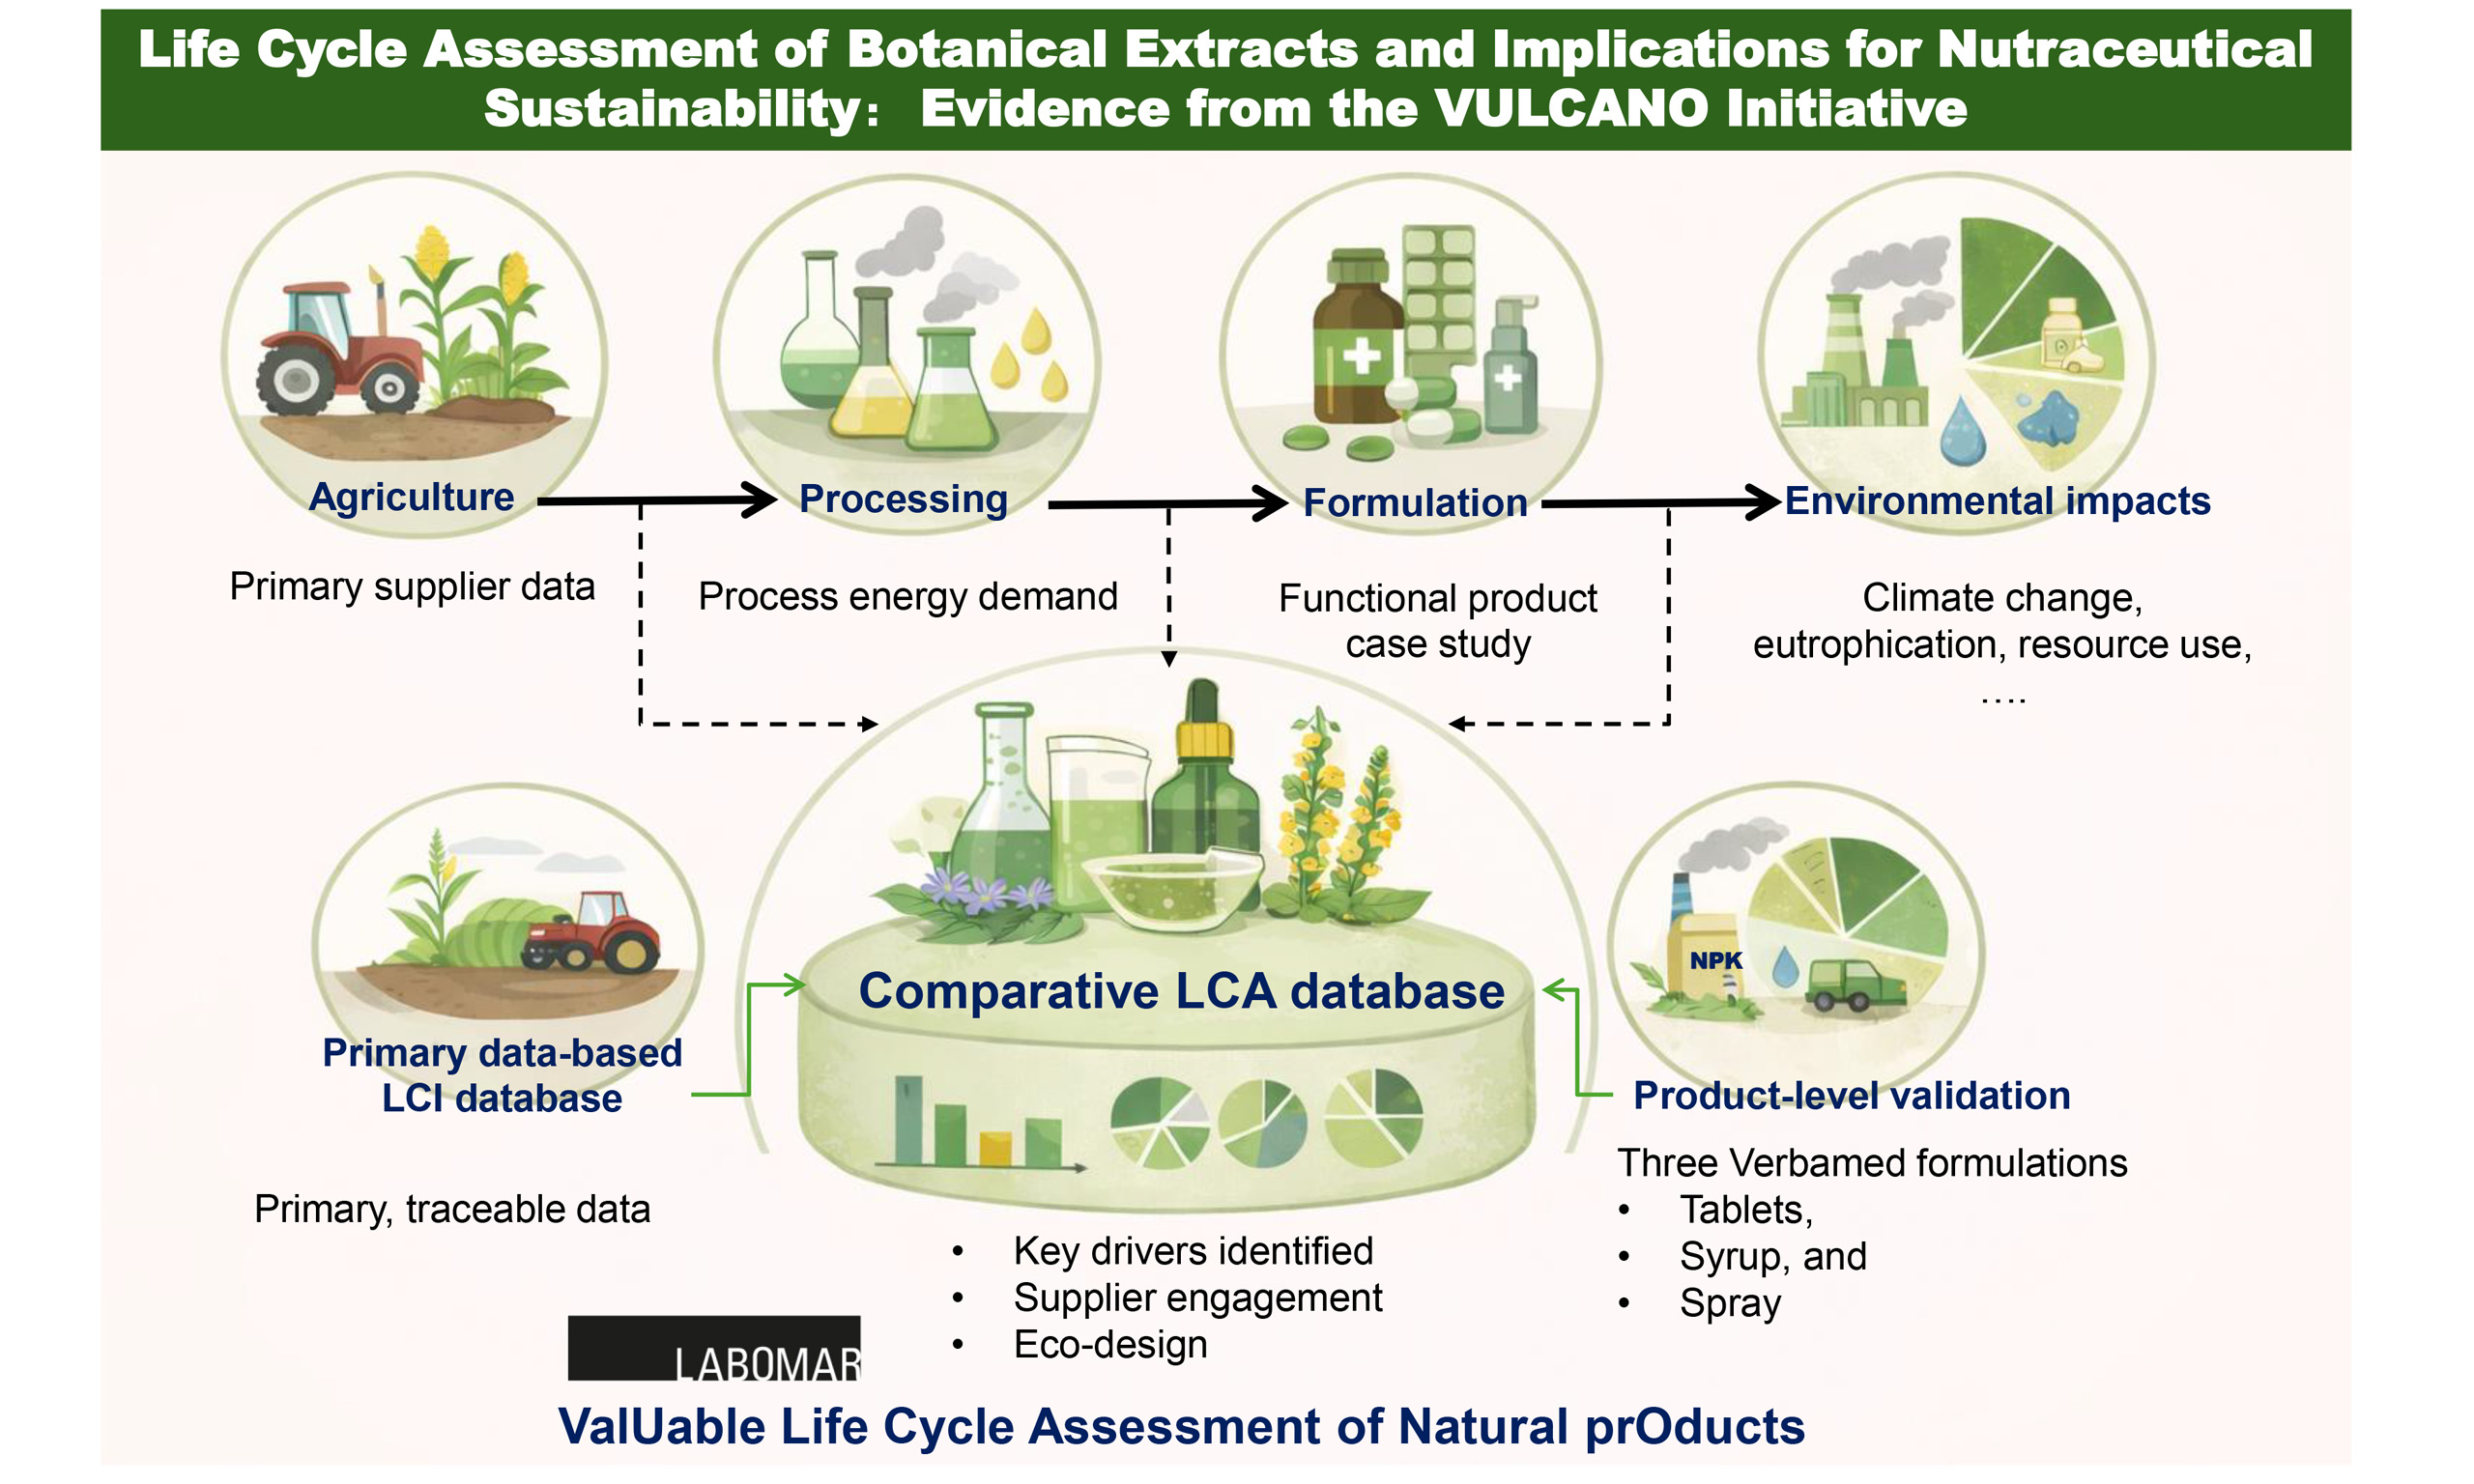
In order to address these methodological challenges, Labomar launched the VULCANO project (ValUable Life Cycle Assessment of Natural prOducts) in October 2023. The initiative is carried out with the scientific and technical support of Spin Life Srl, a spin-off of the Department of Civil, Environmental, and Architectural Engineering of the University of Padua, and received funding from NextGenerationEU (CUP B73D24000090004). The main objective of the project is to generate robust and transparent environmental data for botanical extracts, thereby supporting their consistent integration into LCA studies and corporate carbon accounting.
To achieve this objective, the project team conducted an extensive investigation of the agronomic practices, harvesting techniques, drying processes, extraction technologies, and industrial transformation steps involved in the production of selected botanical ingredients. The Labomar supply chain was actively involved in this process, and primary, product-specific data were collected directly from raw material suppliers and manufacturers, including Italian, other European, and extra-European producers. Multiple supply chain configurations were mapped to capture differences in cultivation conditions, technologies, and geographical contexts. Primary process data were complemented, when necessary, by secondary information sourced from peer-reviewed literature and international LCI databases. These datasets were harmonized and used to construct a comprehensive LCI database specifically tailored to the nutraceutical sector. The resulting LCI models enable a detailed and science-based quantification of the environmental impacts associated with various botanical extracts. From a scientific perspective, the VULCANO project provides new sector-specific knowledge to the existing literature on LCA applications in the nutraceutical field and offers a structured basis for future research on the environmental performance of plant-based products.
METHODS
Goal and scope
Building on the preliminary literature review, which highlighted the limited availability of consistent LCI data for botanical extracts used in nutraceutical formulations, the primary goal of this study was to develop a transparent and methodologically consistent LCI database for a selection of key botanical extracts, mainly purchased by Labomar from its suppliers. A total of nine botanical extracts, derived from eight different plant species, were considered. This selection was made to reflect ingredients that are relevant in Labomar’s product portfolio and to ensure a representative coverage of different plant matrices and extraction processes. The plant species included in the analysis were: Althea, Grindelia, Artichoke, Verbascum, Plantago, Hawthorn, Lemon Balm, and Blueberry. The geographical and technical characteristics of the extracts are reported in Table 1.
Characteristics of the botanical extracts under study
| Extract | Cultivation site | Extraction site | Extraction Processes |
| Althea extract | China + Europe | China | Solvent extraction |
| Hawthorn extract | Eastern Europe | Italy | Solvent extraction |
| Artichoke extract | China + Europe | China + Italy | Water extraction |
| Grindelia extract | Italy | Italy | Water extraction |
| Lemon balm extract | China + Europe | China + Italy | Water extraction |
| Blueberry extract | China | China | Solvent extraction |
| Plantago extract | Poland | Italy | Water extraction |
| Plantago sol extract | Poland | Italy | Solvent extraction |
| Verbascum extract | Eastern Europe | Italy | Water extraction |
The functional unit was defined as 1 kg of standardized botanical extract on a dry basis. The system boundaries include all processes from raw material cultivation to delivery of the final extract to Labomar, as illustrated in Figure 1. Specifically, the foreground system comprises: (i) upstream agricultural and pre-processing stages, including plant cultivation, harvesting, drying, and primary treatments; and (ii) downstream industrial processing stages, including extraction, concentration, granulation, and the extract packaging. All energy inputs (electricity and thermal energy), process and recipe auxiliaries, and packaging materials required along the production chain were included within the system boundaries. Associated emissions to air, solid waste, and water discharges generated during cultivation and processing are also accounted for. Transport processes between consecutive life cycle stages were included where relevant and modelled with the defined system boundary. Intermediate storage was included by accounting for storage-related electricity consumption and transport from suppliers to Labomar. Processes related to downstream formulation into consumer products, distribution to retailers, use phase, and end-of-life management are excluded, in accordance with the cradle-to-gate goal of the study. The intended audience included sustainability practitioners, LCA researchers, nutraceutical and pharmaceutical manufacturers, policy makers, and other stakeholders interested in the environmental performance of botanically derived ingredients.
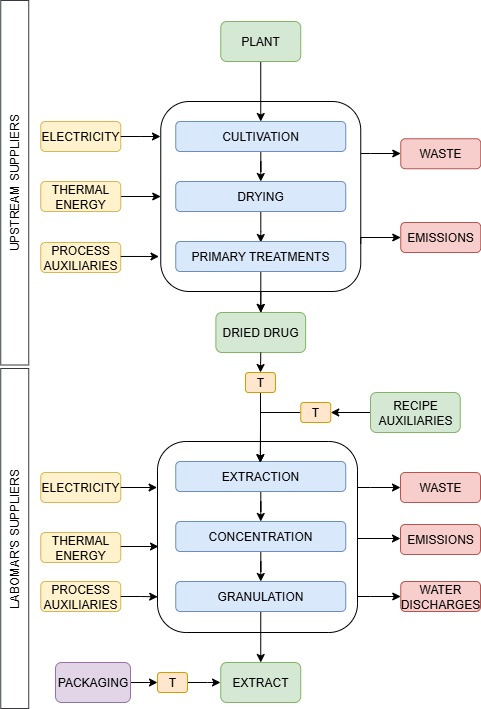
Figure 1. System boundaries of the studied system. Created by the authors using Microsoft Visio.
The new LCI database was defined as a structured archive of quantitative data describing all relevant input and output flows of materials and energy associated with a reference product or process. Such databases are used to populate LCA software tools and support the calculation of potential environmental impacts. Additionally, the construction of the botanical extract database followed the standard steps of LCI compilation, including data collection, validation, harmonization, and modelling.
Product-specific primary data were collected throughout the Labomar supply chain. This process involved direct collaboration with raw material suppliers and manufacturers, including Italian, other European, and extra-European producers. Information was gathered through structured questionnaires, technical documentation, and direct exchanges with the companies involved. The data covered the main stages of the life cycle of botanical extracts, namely cultivation, harvesting, drying, extraction, concentration, and subsequent industrial processing steps. When primary data were unavailable, secondary data were sourced from peer-reviewed literature and established international LCI databases, ensuring methodological consistency and transparency in the modelling choices.
Inventory analysis
In line with the objective of building a new LCI database, all upstream processes involved in the production of botanical extracts supplied to Labomar were systematically characterized. The process began with cultivating the plant species, followed by a series of primary treatments that result in the production of dried botanical material. This intermediate product was then subjected to extraction and further industrial processing to obtain the final botanical extracts. The system boundaries extend from plant cultivation to the packaged finished product at the Labomar gate.
The production chain of the botanical extracts began with agricultural cultivation and involved multiple processing stages. These stages included: (a) cultivation of the plant species; (b) drying of the whole plant or specific parts; (c) primary treatments such as cutting, sieving, grinding, and defoliation; and (d) extraction, concentration, granulation, and optional pasteurization using specific recipe auxiliaries. With regard to the cultivation phase, farmers were asked to provide primary data to characterize cultivation practices for individual suppliers. The requested data included quantities produced during the reference period, land use, the quantity and type of fertilizers used, the quantity and type of plant protection products applied, water consumption, diesel fuel used to power agricultural machinery, and waste and process losses.
Due to the absence of reliable literature data characterizing these processing stages, Labomar conducted targeted research on the main cultivation, drying, extraction, and industrial processing methods. Primary data were collected for the following tasks: (a) resource consumption associated with cultivation, drying, and primary treatments, (b) transportation of raw materials to the extraction facility, (c) raw materials and packaging used at this stage, (d) production processes at the extraction facility, and (e) waste generation during extract manufacturing. Intermediate storage occurred at the same production site and thus only involved electricity consumption, without additional transport processes. The cultivators of the plants used to produce the extracts provided only aggregate data on the total quantity of fertilizers used in the reference year, without distinguishing by type. Based on IFASTAT data for 2022 (the latest available year), the main fertilizer categories accounting for more than 90% of total use were considered. The total quantities of fertilizers reported by the growers were consequently reallocated according to the categories identified by IFASTAT. The inventory of data collected from the various growers is shown in Table 2 with the reallocation of the total quantity of fertilizers across the selected main categories. The data refer to the production of 1 kg of plant material. It should be noted that all inventory data reported in Table 2, including land use values, are based on primary data provided directly by the growers for the reference year. These data reflect the specific agronomic conditions and production performance of individual suppliers. In particular, the land use value reported for artichoke cultivated in China is significantly higher than in other cases, representing a supplier-specific outlier. The primary data were not modified in order to preserve the representativeness and transparency of the real-world production system analyzed.
Inventory data for plant cultivation
| Flow | Unit | Althea - Europe | Althea - China | Hawthorn - Eastern Europe | Artichoke - Europe | Artichoke - China | Grindelia - Italy | Lemon Balm - Europe | Lemon Balm - China | Blueberry - China | Plantago - Poland | Verbascum - Eastern Europe |
| Land use | m2 | 3.333 | 0.842 | 2.051 | 1.100 | 255.000 | 1.154 | 1.067 | 0.350 | 0.670 | 1.067 | 1.067 |
| Irrigation Water | m3 | 0.100 | 0.001 | 0.000 | 0.060 | 0.060 | 0.051 | 0.053 | 0.000 | 1.000 | 0.053 | 0.053 |
| Fertilizers - calcium nitrate | kg | 5.88E-03 | 2.94E-03 | 0.00E+00 | 4.20E-03 | 0.00E+00 | 2.66E-03 | 3.78E-03 | 0.00E+00 | 4.20E-03 | 3.78E-03 | 3.78E-03 |
| Fertilizers - ammonium nitrate | kg | 7.98E-03 | 3.99E-03 | 0.00E+00 | 5.70E-03 | 0.00E+00 | 3.61E-03 | 5.13E-03 | 0.00E+00 | 5.70E-03 | 5.13E-03 | 5.13E-03 |
| Fertilizers - diammonium phosphate | kg | 3.78E-03 | 1.89E-03 | 0.00E+00 | 2.70E-03 | 0.00E+00 | 1.71E-03 | 2.43E-03 | 0.00E+00 | 2.70E-03 | 2.43E-03 | 2.43E-03 |
| Fertilizers - urea | kg | 7.56E-03 | 3.78E-03 | 0.00E+00 | 5.40E-03 | 0.00E+00 | 3.42E-03 | 4.86E-03 | 0.00E+00 | 5.40E-03 | 4.86E-03 | 4.86E-03 |
| Fertilizers - NPK | kg | 1.09E-02 | 5.46E-03 | 0.00E+00 | 7.80E-03 | 0.00E+00 | 4.94E-03 | 7.02E-03 | 0.00E+00 | 7.80E-03 | 7.02E-03 | 7.02E-03 |
| Fertilizers - K2O | kg | 3.36E-03 | 1.68E-03 | 0.00E+00 | 2.40E-03 | 0.00E+00 | 1.52E-03 | 2.16E-03 | 0.00E+00 | 2.40E-03 | 2.16E-03 | 2.16E-03 |
| Fertilizers - urea and ammonium nitrate | kg | 2.52E-03 | 1.26E-03 | 0.00E+00 | 1.80E-03 | 0.00E+00 | 1.14E-03 | 1.62E-03 | 0.00E+00 | 1.80E-03 | 1.62E-03 | 1.62E-03 |
| Diesel | MJ | 2.26E+00 | 2.26E+00 | 9.78E-01 | 8.27E-01 | 8.27E-01 | 7.15E-01 | 7.52E-01 | 0.00E+00 | 1.13E-01 | 7.52E-01 | 7.52E-01 |
| Drying yield | / | 8% | 40% | 13% | 15% | 20% | 13% | 13% | 96% | 95% | 13% | 13% |
| Primary treatment Yield | / | 96% | 98% | 48% | 73% | 90% | 65% | 73% | 99% | 92% | 91% | 93% |
The extraction, concentration and granulation processes were carried out by a Labomar subsidiary. Primary data for these processes were collected from the company. Specifically, the collected data included: the types of solvent used for the extraction process; electricity, water, natural gas and any auxiliary materials used in the plant. The extraction process generally uses solvents or water to extract compounds of interest from the plants. Regarding the cultivation phase, it was considered that the entire plant contributes to the production of the drug and therefore any co-products generated from the plant itself were not considered. For the cultivation phase, the entire plant was assumed to contribute to the production of dried botanic material; therefore, co-products generated from the plant were excluded.
For all the phases involved, primary data collection was conducted for the reference period January to December 2023. Specific data related to the analyzed product system were obtained through direct engagement with all actors across the supply chain, ensuring a high level of detail and reliability of the environmental inventory. Secondary data were used to complement the analysis, sourced from recognized LCA databases including Ecoinvent v3.10, Agri-footprint v6.3, and Agribalyse v3.1.1. These datasets were applied to model: (1) extraction and processing of raw materials used in the extracts, (2) emissions from fertilizer use during cultivation based on Quantis, “Ecoinvent tool model description”, 2018[10] (3) transportation processes, including fuel consumption, road infrastructure, and combustion emissions; (4) operating machines, including construction and operational emissions, and (5) electricity consumption, including transmission and distribution losses.
To facilitate data collection, a standardized data sheet was developed and distributed to each upstream supplier. These sheets captured input and output data in terms of mass and energy flows, as well as emissions across environmental compartments (air, water, soil) for the products and facilities under analysis. The LCI database was constructed using SimaPro software (version 10.2.0.2)[11]. The cultivation process for each plant species was modelled starting from the blueberry cultivation dataset available in AGRIBALYSE® v3.1 database[12], which was then adapted based on the specific characteristics of the plants under study and the collected primary data. The direct emissions on air, water and soil due to the cultivation phase were calculated for each plant following the methodology outlined in the Quantis report “Models integrated in Ecoinvent LCI calculation tool for crop production”[10]. Subsequent production stages and the recipe auxiliaries were characterized using primary data and modelled with datasets from Ecoinvent and AGRIBALYSE®.
Impact categories
To perform a pilot evaluation of the environmental impacts associated with the production of botanical extracts, the impact categories defined by the Environmental Footprint (EF) method version 3.1[13] were applied. This method, developed under the Product Environmental Footprint (PEF) initiative, was selected because it is widely used and recommended at the European level. It also provides a harmonized and policy-aligned set of mid-point indicators while ensuring consistency and comparability across studies. In this study, the following EF 3.1 impact categories were considered, i.e., acidification; climate change; ecotoxicity, freshwater; particulate matter; eutrophication, marine; eutrophication, freshwater; eutrophication, terrestrial; human toxicity, cancer; human toxicity, non-cancer; ionizing radiation; land use; ozone depletion; photochemical ozone formation; resource use, fossils; resource use, minerals and metals; and water use. For the climate change impact category, the time horizon considered is 100 years (GWP100).
Case study description
To validate the applicability of the botanical extract LCI database at the product level, a pilot case study was conducted on Verbamed (Labomar), a substance-based oral medical device used for cough symptom relief. Verbamed contains Verbascum extract, one of the botanical extracts modelled in the VULCANO database, and is marketed in three formulations: spray, syrup, and oral tablets. A summary of the case study definition, including functional unit, system boundaries, data quality, and modelling assumptions, is provided in Table 3.
Definition of the Verbamed case study and modelling assumptions
| Scope | Technical description |
| Functional unit | Maximum daily dose administered, equivalent to the following reference flows: (a) Verbamed tablets: 6 tablets (6.6 g total), (b) Verbamed syrup: 30 mL, and c) Verbamed spray: 3 × 6 puffs (3.6 mL) |
| System boundaries | From cradle-to-gate (from cultivation of the plant to the packaged product at the Labomar gate) |
| Data quality | Primary data: to characterise materials and processes related to cultivation, drying, botanical extraction and industrial processing; Verbascum extract from the created database. Secondary data: emissions generated during cultivation, auxiliary recipe composition, energy carriers and transport |
| Data reference period | 01/01/2023 - 31/12/2023 |
| Geographical data | Italy, Europe |
| Energy mix | Italian, with the dataset: Electricity, medium voltage {IT}| electricity, medium voltage, residual mix | Cut-off, U |
| Software | SimaPro v 10.2.0.2 |
| Database | Ecoinvent v. 3.10; Agri footprint v. 6.3; AGRIBALYSE v. 3.1.1 |
| LCA Method | Cut-off by classification |
| Characterization factors | Method EF 3.1 |
An LCA was performed for each formulation to compare potential environmental impacts on a functionally equivalent basis. Because the primary function of the product is dose delivery, the functional unit is defined as the maximum daily dose administered, corresponding to the following reference flows: 6 tablets (6.6 g), 30 mL syrup, and 3 × 6 puffs spray (3.6 mL). The system boundaries follow a cradle-to-gate approach, from plant cultivation to the packaged finished product at the Labomar gate. Primary data are used to model cultivation, drying, extraction, and industrial processing, including the Verbascum extract dataset from the developed database; secondary data were used for background processes (e.g., energy supply, transport, and auxiliary recipe components). Modelling is implemented in SimaPro v10.2.0.2 using Ecoinvent 3.10, Agri-footprint 6.3, and AGRIBALYSE 3.1.1, with EF 3.1 characterization and the cut-off by classification system model. The reference period is 2023 and the electricity mix is the Italian residual mix dataset.
RESULTS
Comparative environmental impacts of the assessed botanical extracts
The life cycle impact assessment results for the nine botanical extracts, expressed per 1 kg of extract on a dry basis, reveal moderate variability across most impact categories, with some indicators showing pronounced differences linked to agricultural inputs and production characteristics [Table 4].
Results of the impact assessment for the botanical extracts
| Impact category | Unit | Althea extract | Hawthorn extract | Artichoke extract | Grindelia extract | Lemon balm extract | Blueberry extract | Plantago extract | Plantago sol extract | Verbascum extract |
| Acidification | mol H+ eq | 1.22E-02 | 1.19E-02 | 1.17E-02 | 8.74E-03 | 1.08E-02 | 1.26E-02 | 8.84E-03 | 9.36E-03 | 7.79E-03 |
| Climate change | kg CO2 eq | 3.18E+00 | 3.12E+00 | 3.22E+00 | 2.71E+00 | 3.10E+00 | 3.33E+00 | 2.77E+00 | 2.73E+00 | 2.59E+00 |
| Ecotoxicity, freshwater | CTUe | 1.37E+01 | 1.43E+01 | 1.37E+01 | 1.14E+01 | 1.36E+01 | 1.27E+01 | 1.26E+01 | 1.23E+01 | 8.12E+00 |
| Particulate matter | disease inc. | 1.46E-07 | 1.35E-07 | 1.36E-07 | 7.81E-08 | 1.35E-07 | 1.49E-07 | 8.04E-08 | 8.23E-08 | 7.30E-08 |
| Eutrophication, marine | kg N eq | 3.18E-03 | 5.14E-03 | 1.09E-01 | 2.70E-03 | 2.81E-03 | 3.13E-03 | 2.63E-03 | 2.82E-03 | 2.10E-03 |
| Eutrophication, freshwater | kg P eq | 5.92E-04 | 3.52E-03 | 6.73E-01 | 4.77E-04 | 5.68E-04 | 5.59E-04 | 8.80E-04 | 1.05E-03 | 4.72E-04 |
| Eutrophication, terrestrial | mol N eq | 3.22E-02 | 3.29E-02 | 3.04E-02 | 2.62E-02 | 2.74E-02 | 3.25E-02 | 2.62E-02 | 2.88E-02 | 2.26E-02 |
| Human toxicity, cancer | CTUh | 9.60E-09 | 8.87E-09 | 9.59E-09 | 9.14E-09 | 9.61E-09 | 9.43E-09 | 1.02E-08 | 1.03E-08 | 8.60E-09 |
| Human toxicity, non-cancer | CTUh | 2.08E-08 | 1.64E-08 | 1.99E-08 | 1.35E-08 | 1.96E-08 | 2.06E-08 | 1.70E-08 | 1.65E-08 | 1.34E-08 |
| Ionizing radiation | kBq U-235 eq | 1.35E-01 | 1.39E-01 | 1.39E-01 | 1.16E-01 | 1.34E-01 | 1.35E-01 | 1.15E-01 | 1.14E-01 | 1.11E-01 |
| Land use | Pt | 3.51E+01 | 2.35E+02 | 1.10E+04 | 7.92E+01 | 2.89E+01 | 3.50E+01 | 5.94E+01 | 7.25E+01 | 5.35E+01 |
| Ozone depletion | kg CFC11 eq | 6.55E-08 | 1.57E-07 | 7.54E-08 | 1.23E-07 | 5.92E-08 | 6.71E-08 | 1.11E-07 | 1.22E-07 | 1.08E-07 |
| Photochemical ozone formation | kg NMVOC eq | 1.06E-02 | 1.05E-02 | 1.11E-02 | 7.48E-03 | 9.69E-03 | 1.05E-02 | 7.80E-03 | 7.57E-03 | 6.89E-03 |
| Resource use, fossils | MJ | 4.59E+01 | 4.27E+01 | 4.82E+01 | 4.01E+01 | 4.56E+01 | 4.58E+01 | 4.22E+01 | 4.01E+01 | 3.84E+01 |
| Resource use, minerals and metals | kg Sb eq | 8.28E-06 | 7.78E-06 | 8.50E-06 | 6.43E-06 | 7.65E-06 | 6.77E-06 | 7.40E-06 | 6.87E-06 | 5.20E-06 |
| Water use | m3 depriv. | 1.43E+01 | 1.39E+01 | 1.78E+01 | 1.78E+01 | 1.43E+01 | 3.22E+01 | 1.54E+01 | 1.58E+01 | 1.66E+01 |
Climate change impacts range from 2.59 kg CO2-eq·kg-1 (Verbascum extract) to 3.33 kg CO2-eq·kg-1 (Blueberry extract), corresponding to a relative difference of approximately 29% between the lowest and highest values. Most extracts cluster within a relatively narrow interval between 2.7 and 3.2 kg CO2-eq·kg-1, indicating broadly comparable carbon footprints when assessed under harmonized system boundaries. A similar pattern is observed for resource use, fossils, which varies between 38.4 MJ·kg-1 (Verbascum) and 48.2 MJ·kg-1 (Artichoke), with a maximum relative difference of about 25%. Extracts exhibiting higher climate change impacts generally show higher fossil resource use, confirming the close relationship between energy demand and greenhouse gas emissions across the assessed systems.
For acidification, results range from 7.79 × 10⁻³ mol H+ eq (Verbascum) to 1.26 × 10⁻² mol H+ eq (Blueberry), corresponding to an approximate variation of 60%. Particulate matter formation shows a comparable spread, with values between 7.30 × 10⁻⁸ disease incidences (Verbascum) and 1.49 × 10⁻⁷ disease incidences (Blueberry). These categories display consistent rankings with climate change and fossil resource use, reflecting the influence of combustion-related energy processes and auxiliary inputs. Photochemical ozone formation varies from 6.89 × 10⁻³ kg NMVOC eq (Verbascum) to 1.11 × 10⁻² kg NMVOC eq (Artichoke), while ozone depletion ranges from 5.92 × 10⁻⁸ to 1.57 × 10⁻⁷ kg CFC-11 eq, with Hawthorn extract showing the highest value.
Eutrophication-related impacts exhibit the largest variability across extracts, particularly for freshwater eutrophication. Values range from 4.72 × 10⁻⁴ kg P eq (Verbascum) to 6.73 × 10⁻¹ kg P eq (Artichoke), spanning more than three orders of magnitude. A similar, though less pronounced, pattern is observed for marine eutrophication, which ranges from 2.10 × 10⁻³ to 1.09 × 10⁻¹ kg N eq, with Artichoke extract again exhibiting the highest value. These results indicate that eutrophication indicators are strongly influenced by crop-specific fertilizer requirements and nutrient management practices. By contrast, terrestrial eutrophication shows a narrower range, from 2.26 × 10⁻² to 3.29 × 10⁻² mol N eq, corresponding to a relative difference of approximately 45% across extracts. Freshwater ecotoxicity values range from 8.12 CTUe (Verbascum) to 14.3 CTUe (Hawthorn), showing moderate variability across extracts.
The elevated values observed for freshwater eutrophication and land use associated with the artichoke extract reflect the primary inventory data provided by the farmers. As shown in Table 2, artichokes cultivated in China exhibit substantially higher land use values than the other suppliers, resulting in higher impacts in the categories most directly associated with land use. Human toxicity impacts, including both cancer and non-cancer effects, display comparatively limited variation. Cancer toxicity ranges between 8.60 × 10⁻⁹ and 1.03 × 10⁻⁸ CTUh, while non-cancer toxicity varies from 1.34 × 10⁻⁸ to 2.08 × 10⁻⁸ CTUh, indicating less than a twofold difference across all extracts.
Land use exhibits the most pronounced absolute differences among the assessed categories. Values range from 28.9 Pt (Lemon Balm) to 1.10 × 10⁴ Pt (Artichoke), highlighting the strong influence of crop yield and agricultural intensity on land occupation impacts. This indicator exhibits substantially higher variability than climate change and other energy-related categories. Water use ranges from 13.9 m3 deprivation (Hawthorn) to 32.2 m3 deprivation (Blueberry), corresponding to a relative difference of approximately 130%. Blueberry extract stands out as the most water-intensive option among the analyzed extracts. Overall, the results indicate that while most botanical extracts exhibit comparable performance in energy- and emission-related categories, certain impact categories, particularly freshwater eutrophication and land use, are strongly influenced by crop-specific agricultural characteristics. Transport-related differences do not emerge as dominant drivers in any impact category, as variability is primarily associated with process energy demand, auxiliary material inputs, and agricultural yields.
Contribution analysis for climate change impacts across the life cycle of botanical extracts
For clarity and comparability, the contribution analysis focuses on climate change impacts, expressed as kg CO2-eq per kg dry extract. Across the nine botanical extracts, total climate change impacts range from 2.59 kg CO2-eq (Verbascum extract) to 3.33 kg CO2-eq (Blueberry extract), corresponding to a relative difference of approximately 29% (see Figure 2).
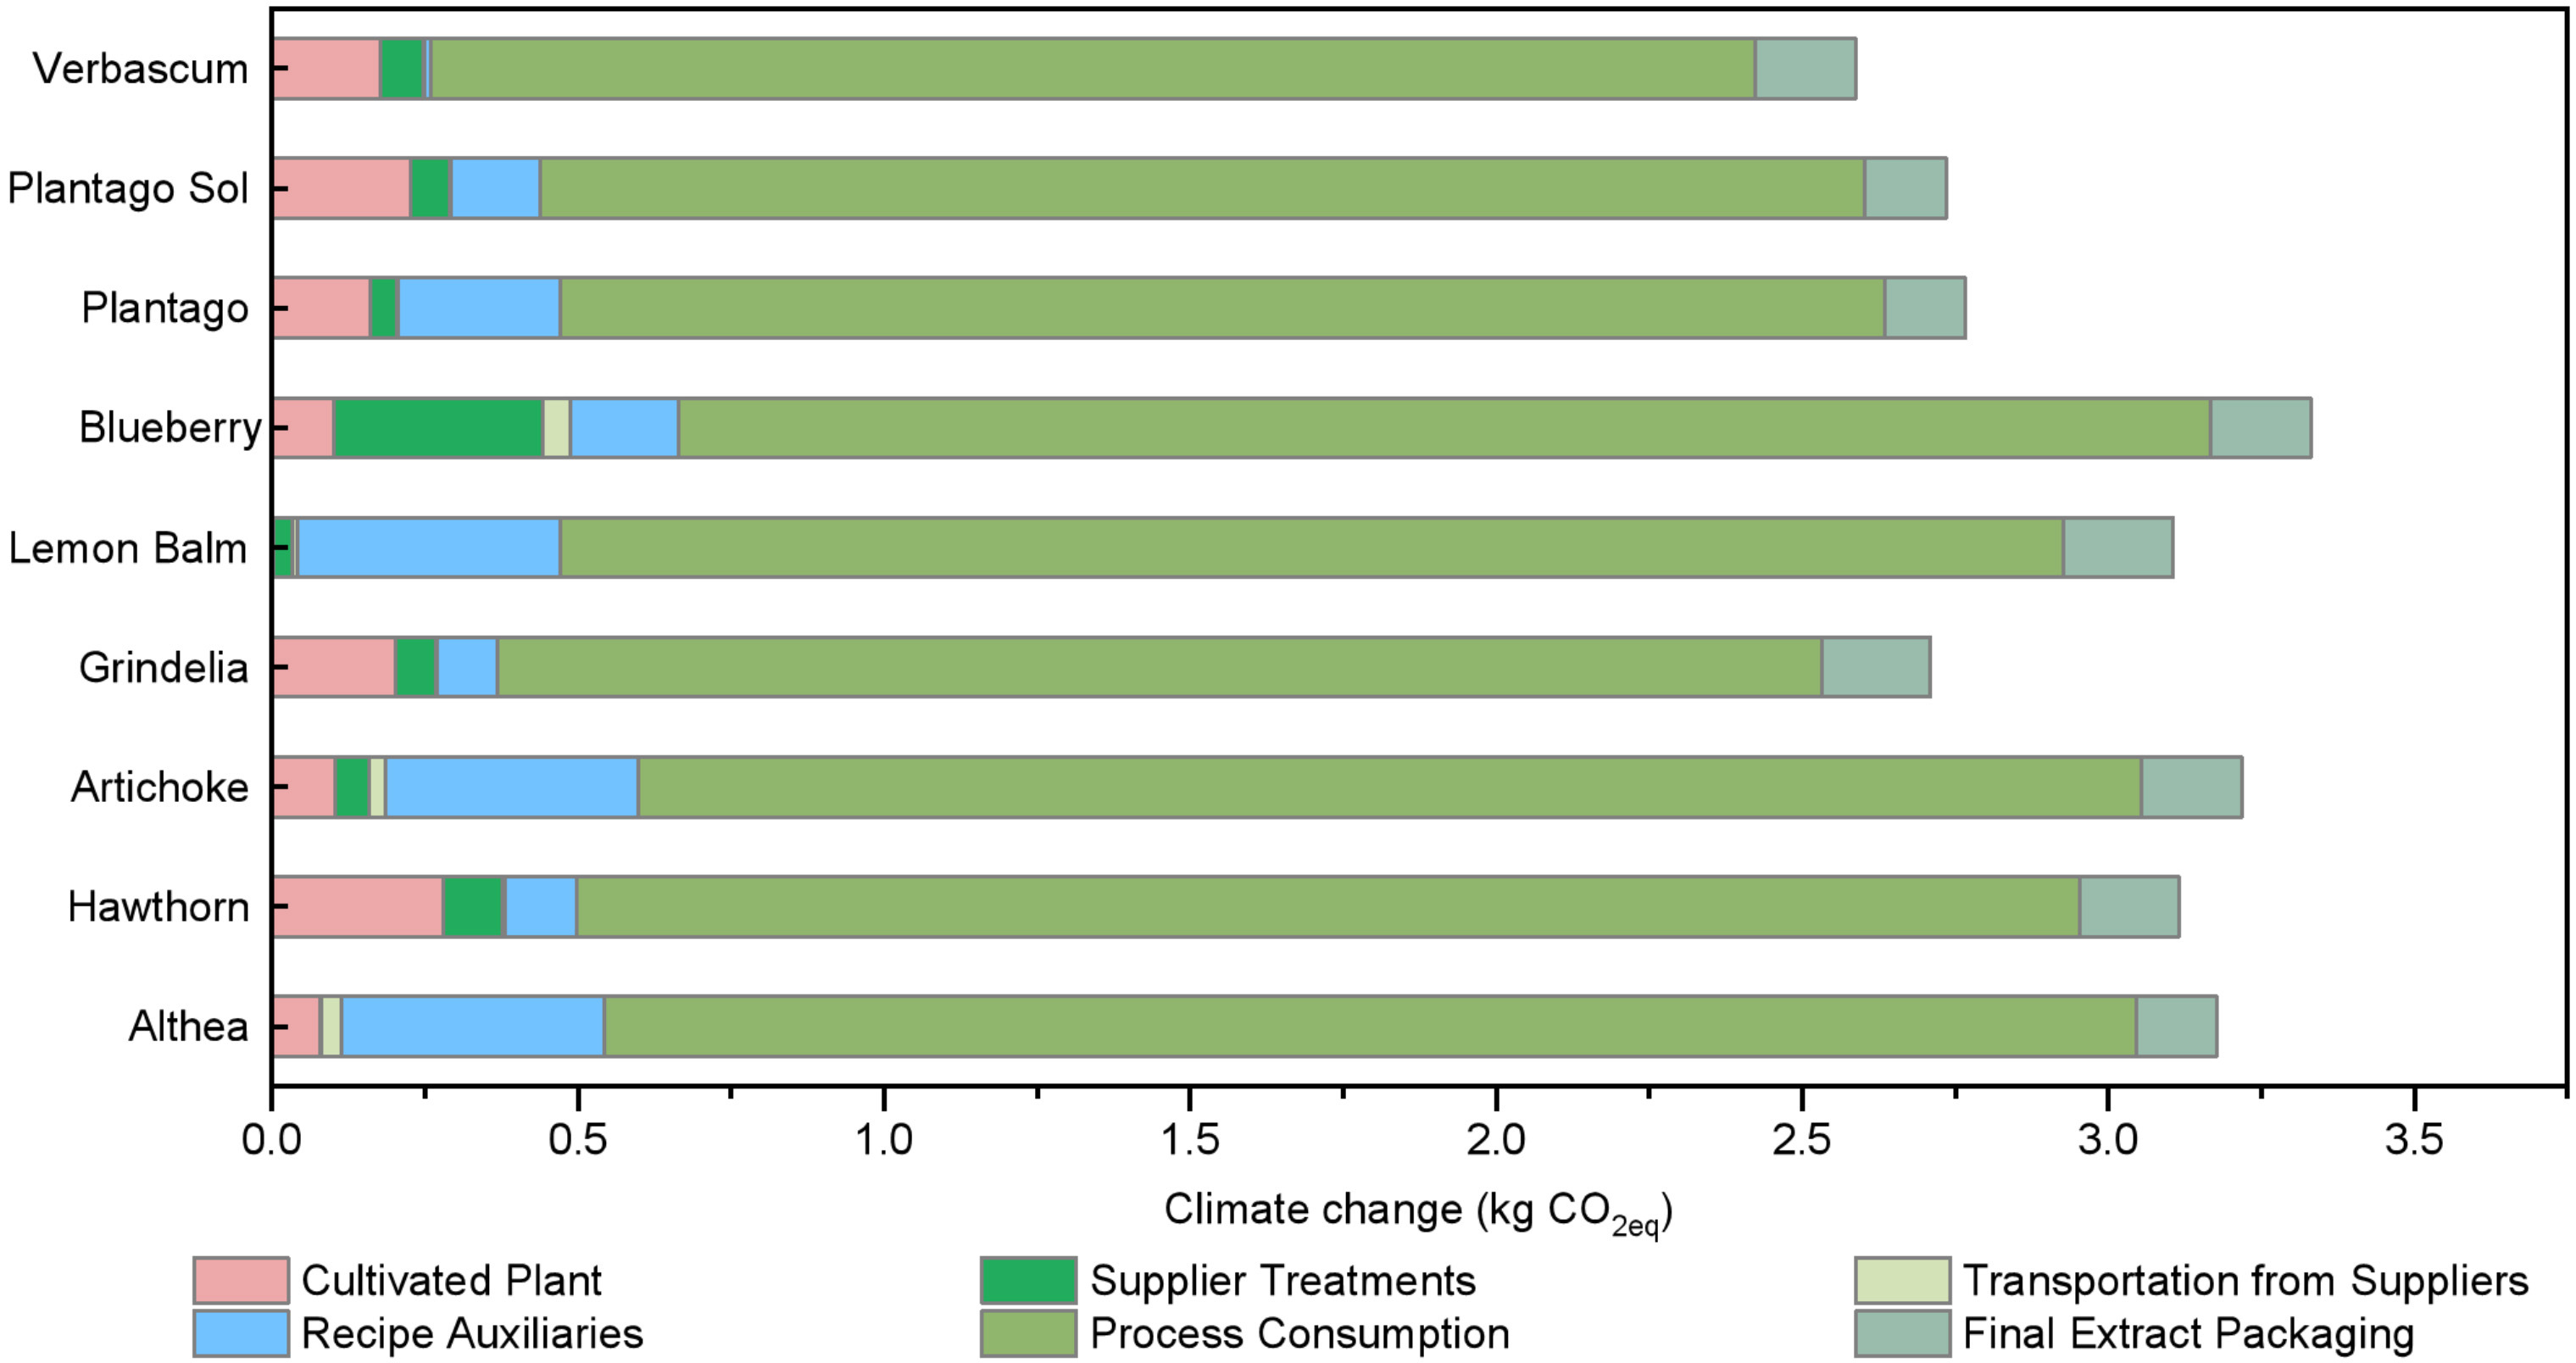
Figure 2. Contribution breakdown of climate change impacts across the life cycle stages. Created by the authors using OriginLab Pro.
Across all extracts, process-related energy consumption (electricity and thermal energy used during extraction, concentration, and downstream processing) represents the dominant contribution, ranging from 2.16 kg CO2-eq to 2.50 kg CO2-eq. In relative terms, this corresponds to 67–84% of total climate change impacts, with the highest shares observed for extracts with lower auxiliary material inputs (e.g. Verbascum, Plantago Sol, and Grindelia). The absolute contribution of process energy consumption varies by less than 0.35 kg CO2-eq across extracts, indicating relatively limited variability compared with other life cycle stages. Recipe auxiliaries represent the second most influential contribution, but with substantially higher variability across extracts. Contributions range from 0.01 kg CO2-eq (Verbascum extract) to 0.43 kg CO2-eq (Lemon Balm and Althea extracts), corresponding to a variation exceeding a factor of 35. In relative terms, recipe auxiliaries account for < 1% to approximately 14% of total climate change impacts, explaining a significant share of the inter-extract variability observed in total results. The contribution from plant cultivation ranges from 0.002 kg CO2-eq (Lemon Balm) to 0.28 kg CO2-eq (Hawthorn), corresponding to < 0.1% to approximately 9% of total impacts. Supplier-specific treatments show a similar level of variability, spanning from 0.004 kg CO2-eq (Althea) to 0.34 kg CO2-eq (Blueberry). Together, these two stages contribute between approximately 3%-17% of total climate change impacts, depending on the extract. Transportation from suppliers contributes marginally across all extracts, with values between 0.0019 and 0.046 kg CO2-eq, constantly accounting for < 2% of total impacts. The packaging of the extract shows limited variability, ranging from 0.13 kg CO2-eq to 0.18 kg CO2-eq, corresponding to 4%-6% of total climate change impacts across all extracts. Overall, the contribution analysis reveals a highly consistent life cycle structure across botanical extracts, characterized by: (i) the dominance of process energy consumption; (ii) high variability in recipe auxiliaries and supplier treatments; and (iii) constant minor contributions from transport and packaging. These patterns indicate that differences in total climate change impacts among extracts are primarily driven by material and energy intensity within processing and formulation stages, rather than by upstream transport or packaging-related factors.
Product-level validation of the botanical extract database
Product-level impact differentiation and dominance across formulations
The life cycle impact assessment results for the three Verbamed formulations, i.e., tablet, syrup, and spray, are reported in Table 5 for a functionally equivalent unit, defined as the maximum daily dose administered (6 tablets, 30 mL syrup, and 18 spray puffs corresponding to 3.6 mL). Across all assessed impact categories, systematic differences emerge among the formulations, with the spray variant regularly exhibiting the lowest impacts.
Comparison of the three Verbamed formulations using the same functional unit
| Impact category | Unit | Verbamed tablet (6 pcs) | Verbamed syrup (30 mL) | Verbamed spray (3.6 mL) |
| Acidification | mol H+ eq | 3.48E-04 | 4.89E-04 | 1.05E-04 |
| Climate change | kg CO2 eq | 5.43E-02 | 6.75E-02 | 2.04E-02 |
| Ecotoxicity, freshwater | CTUe | 4.20E-01 | 4.00E-01 | 8.63E-02 |
| Particulate matter | disease inc. | 3.15E-09 | 4.41E-09 | 1.05E-09 |
| Eutrophication, marine | kg N eq | 9.81E-05 | 2.50E-04 | 3.08E-05 |
| Eutrophication, freshwater | kg P eq | 1.44E-05 | 1.80E-05 | 5.85E-06 |
| Eutrophication, terrestrial | mol N eq | 1.03E-03 | 1.68E-03 | 2.39E-04 |
| Human toxicity, cancer | CTUh | 2.07E-10 | 2.05E-10 | 5.91E-11 |
| Human toxicity, non-cancer | CTUh | 3.16E-10 | 1.33E-09 | 2.18E-10 |
| Ionizing radiation | kBq U-235 eq | 6.47E-03 | 6.41E-03 | 2.02E-03 |
| Land use | Pt | 9.32E-01 | 1.82E+00 | 2.59E-01 |
| Ozone depletion | kg CFC11 eq | 3.95E-09 | 2.65E-09 | 1.67E-08 |
| Photochemical ozone formation | kg NMVOC eq | 1.78E-04 | 2.34E-04 | 7.11E-05 |
| Resource use, fossils | MJ | 8.43E-01 | 1.06E+00 | 3.37E-01 |
| Resource use, minerals and metals | kg Sb eq | 2.61E-07 | 2.40E-07 | 8.15E-08 |
| Water use | m3 depriv. | 2.26E-01 | 4.12E-02 | 8.53E-03 |
Across the 16 assessed impact categories, the spray formulation exhibits the lowest impacts in 15 categories, with the exception of ozone depletion. This pattern is primarily explained by the lower material and energy intensity of the spray formulation per functional unit. Indicators strongly linked to energy demand, including climate change, fossil resource use, and ionizing radiation, show variation factors of approximately 3-3.5 across formulations. In contrast, categories more sensitive to material throughput and agricultural inputs, such as land use, eutrophication, and water use, exhibit substantially greater variability, in some cases exceeding one order of magnitude.
The syrup formulation exhibits the highest impacts in 10 of the 16 assessed categories, particularly for climate change, eutrophication, and land use. However, this pattern is not universal; for example, the tablet formulation shows the highest value in the water use category. The tablet formulation generally occupies an intermediate position, with impacts falling between those of spray and syrup across most indicators.
Overall, the ranking of the formulations remains consistent despite substantial differences in impact magnitude and variability, indicating that formulation-level differences may outweigh extract-level differences under a functionally equivalent daily dose. These results support the suitability of the developed extract database for comparative product-level environmental assessments.
Product-level contribution analysis of the botanical extract LCI database
From a product-level validation perspective, the contribution analysis of the climate change impact category provides a quantitative test of whether the extract-level LCI data performs invariably when embedded in downstream product systems under a harmonized functional unit.
As shown in Figure 3, across all three Verbamed formulations, the relative contribution structure is stable and consistent, with packaging-related processes (packaging of the extract and specific packaging consumption) representing the largest share of climate change impacts. In absolute terms, packaging-related contributions amount to 0.0305 kg CO2-eq for tablets, 0.0294 kg CO2-eq for syrup, and 0.0166 kg CO2-eq for spray. Despite differences in absolute magnitude, the dominance of packaging across all formulations confirms that the upstream extract inventory does not introduce structural distortions when integrated into product-level modelling.
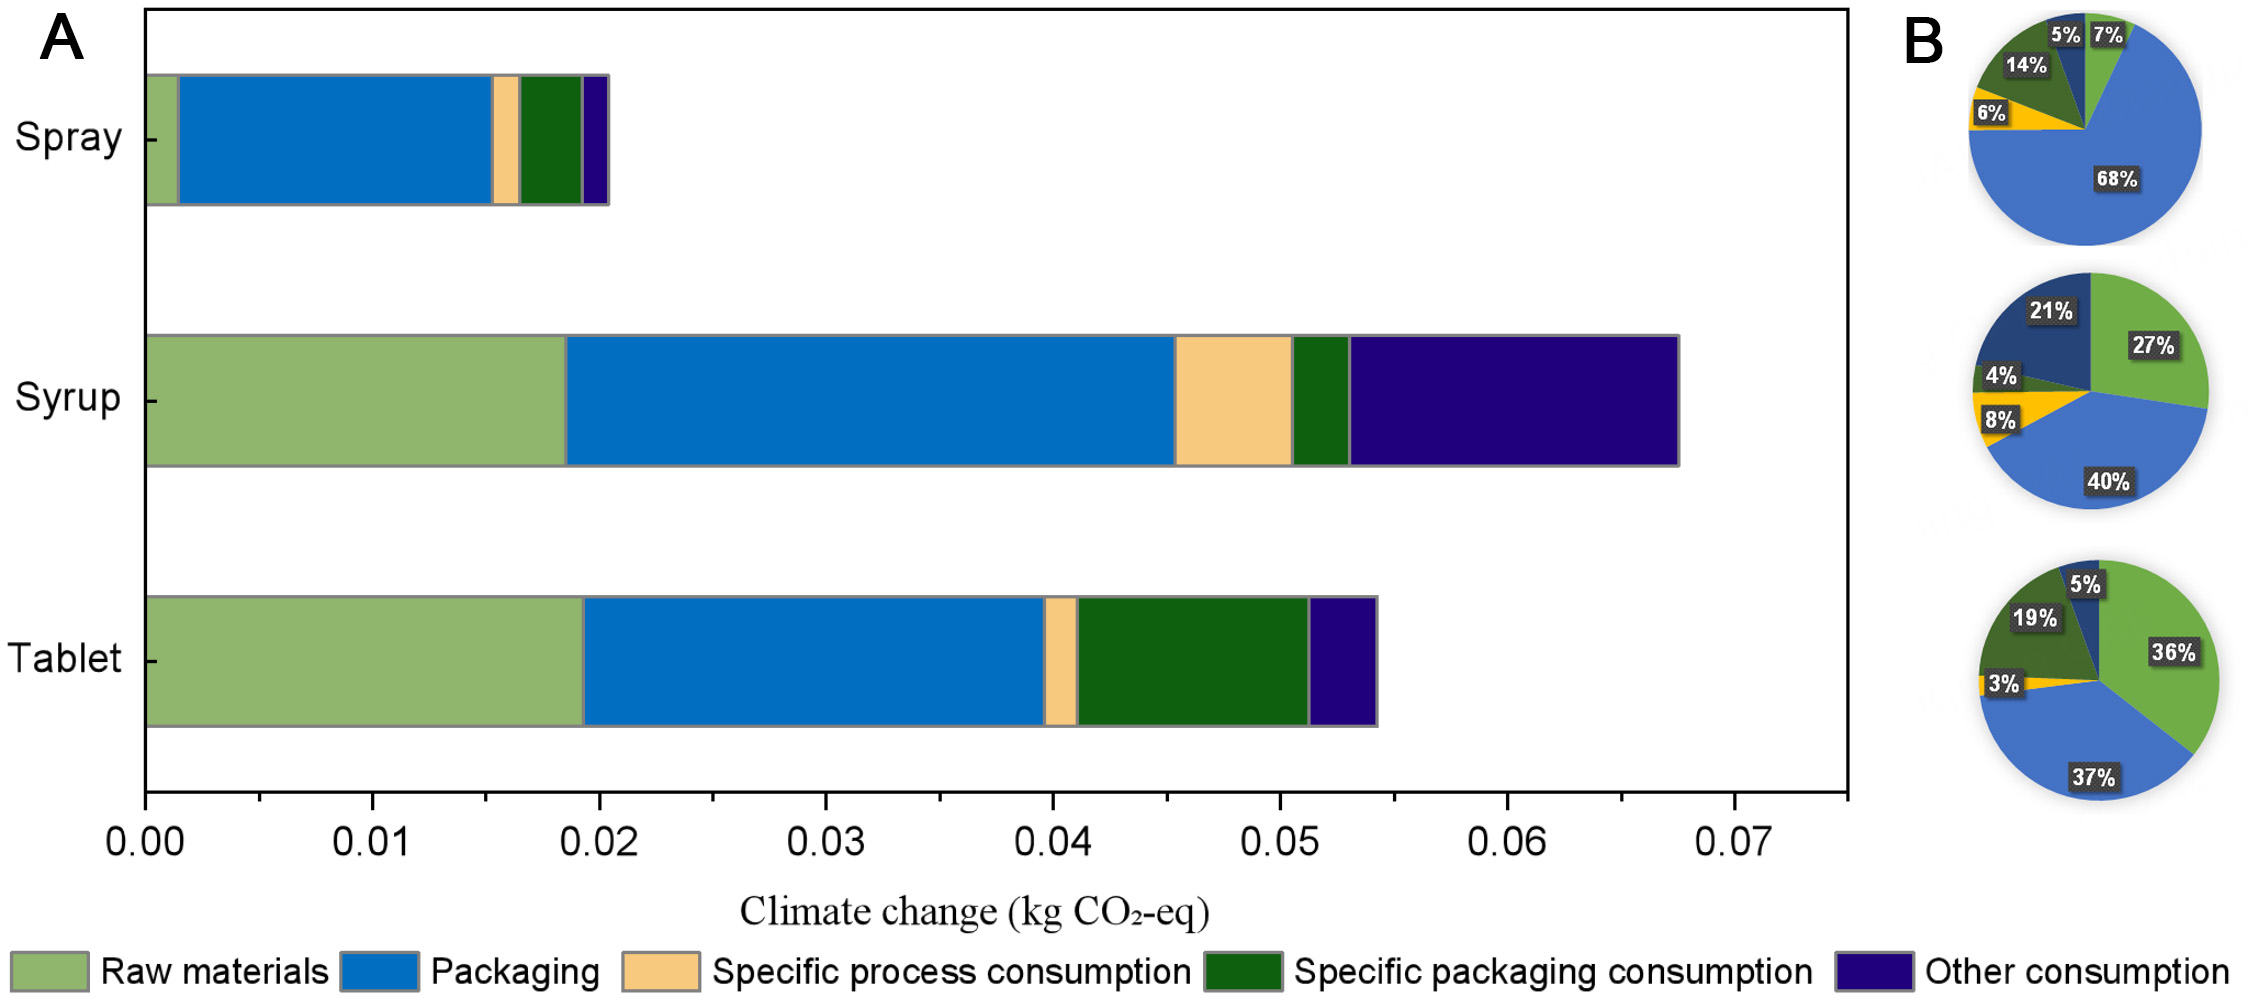
Figure 3. Climate change impacts of the three Verbamed formulations: (A) absolute contributions and (B) relative contribution shares. Created by the authors using OriginLab Pro.
Raw material contributions, which include the botanical extract derived from the developed LCI database, show high internal consistency across formulations when normalized to the functional unit [Figure 3]. Tablets and syrup exhibit comparable values (0.0193 and 0.0185 kg CO2-eq, respectively), while the spray formulation shows a substantially lower contribution (0.00143 kg CO2-eq), reflecting the markedly lower material quantity required to deliver the same function. This proportional scaling indicates that the extract-level LCI data can be integrated into product-level mass-based allocation. Process-specific and packaging-specific consumption display differentiated but internally consistent patterns across formulations. Specific process consumption ranges from 0.00122 kg CO2-eq to 0.00518 kg CO2-eq, with syrup showing the highest value, while specific packaging consumption ranges from 0.00252 kg CO2-eq to 0.01023 kg CO2-eq, with tablets exhibiting the highest contribution. These differences follow the same ranking observed in Section 3.3.1 and remain within a limited absolute range, supporting the robustness of the background modelling assumptions applied uniformly across products. Finally, other consumption contributes between 0.00112 and 0.01448 kg CO2-eq, reinforcing the observed dominance pattern without altering the overall ranking among formulations. The contribution analysis confirms that the botanical extract LCI dataset produces stable, proportional, and interpretable results when transferred from ingredient-level modelling to product-level LCA. The consistent contribution structure, coherent scaling with the functional unit, and absence of anomalous contributions support the applicability and reliability of the developed database for comparative product-level environmental assessments.
DISCUSSION
Interpretation of the main findings and comparison with existing studies
This study contributes to the current literature by providing a structured LCI database based on primary industrial data for a set of botanical extracts commonly used in nutraceutical and substance-based medical device formulations. Existing LCA studies on botanical extracts and bioactive compounds predominantly rely on laboratory-scale experiments or secondary background datasets, which limit the comparability and robustness of reported results.[8,9]. In contrast, the database developed here is grounded in supplier-specific industrial data, capturing real operating conditions for cultivation practices, extraction processes, auxiliary materials, and formulation-related inputs. Across the nine botanical extracts analyzed, climate change impacts range from 2.59 to 3.33 kg CO2-eq per kg dry extract, indicating a relatively constrained variability under harmonized system boundaries and functional units. This range is generally comparable to, or lower than, values reported in existing studies on similar botanical extracts and bioactive compounds, where climate change impacts often span wider intervals due to heterogeneous assumptions and laboratory-scale conditions[8,14]. The reduced dispersion observed in this study highlights the role of consistent foreground modelling and primary industrial data in improving comparability among botanical extract LCAs. The analysis further indicates that differences in environmental performance are mainly associated with process efficiencies and auxiliary material use, rather than geographical origin or transport distances. The processing stage accounts for more than 75% of total climate change impacts across all extracts. Cultivation contributes between 0.1% and approximately 9%, while auxiliary materials associated with formulation and standardization account for 1%-15%, depending on the extract. These findings are consistent with previous LCAs of extraction processes, which identify energy demand and solvent-related inputs as dominant contributors to environmental impacts[9,14]. However, many existing studies simplify auxiliary inputs by aggregating them into generic “chemical use” datasets or excluding them altogether due to data limitations[15-17]. By explicitly modelling these flows based on supplier-specific primary data, the present study demonstrates that auxiliary materials can represent a non-negligible share of total impacts, in some cases comparable to or exceeding cultivation-stage contributions. This finding may partly explain the variability observed across published LCAs and highlights an often-underreported mitigation potential within processing and formulation stages, particularly through improved solvent management and standardization strategies. In contrast, the contribution of transport remains secondary, amounting to less than 1% of total climate change impacts under typical industrial supply-chain conditions. This finding is in line with previous assessments of agro-industrial and botanical product systems[8] and quantitatively supports the conclusion that mitigation strategies in this sector should primarily focus on process optimization, energy efficiency, and auxiliary material management, rather than on transport distance reduction alone.
The pilot case study on a selected nutraceutical product further illustrates the practical applicability of the developed LCI database for product-level LCA and eco-design evaluations. When applying a consistent functional unit based on the maximum daily dose, substantial differences were observed across alternative formulations, despite the use of the same botanical extract. Specifically, the spray formulation exhibits the lowest climate change impact (2.04 × 10⁻² kg CO2-eq per daily dose), which is approximately 62% lower than tablets and 70% lower than syrup formulations. These differences are primarily driven by variations in material demand and packaging intensity, confirming that downstream formulation choices can outweigh differences observed at the extract level. While many existing studies remain confined to ingredient-level assessments, the present work demonstrates how a structured, primary-data-based LCI database can be directly integrated into downstream product assessments. This capability supports more consistent and transparent product-level LCA and organizational emissions accounting, as also emphasized in recent reviews of nutraceutical LCAs[18]. Moreover, the comparison with laboratory-scale studies indicates that the narrower impact ranges observed here are consistent with findings from supercritical CO2 extraction LCAs that explicitly address scale effects and solvent recovery efficiencies[19]. These findings suggest that part of the variability reported in the literature may stem from scale-induced artefacts, rather than intrinsic differences among botanical species.
Sensitivity analysis
To evaluate the robustness of the results, a sensitivity analysis was carried out. The sensitivity analysis focused on the modelling assumption related to the impacts associated with the growth and maintenance of young, non-productive plants. As described in Section 2.2, a 5% increase was applied to the datasets used to model the analyzed plants, based on the average values available in Ecoinvent for similar crops. For the sensitivity analysis, this increase was conservatively doubled to 10%, corresponding to the highest value identified among the available datasets.
Table 6 indicates very limited sensitivity of the impact results to this modelling assumption. Across all extracts and impact categories, the observed variation between the base and altered scenarios remains below 5%, with most indicators exhibiting changes well below 1%. These results confirm the robustness of the environmental assessment with respect to the assumed contribution of juvenile plant growth. Notably, the Blueberry extract shows 0% variation across all impact categories. This is because its cultivation phase was directly modelled using the AGRIBALYSE dataset, which also represents the baseline reference adopted for the sensitivity analysis. As a result, no variation is observed for this extract when applying the tested parameter change, ensuring full internal consistency with the modelling framework. For climate change, which represents the main energy-related category discussed in Sections 3.1 and 3.2, the relative variation ranges between 0.00% (Lemon Balm and Blueberry extracts) and 0.43% (Hawthorn extract). Similar magnitudes are observed for other energy-driven indicators such as resource use, fossils and ionizing radiation, where variations remain below 0.6% across all extracts. These results are consistent with the contribution analysis presented in Section 3.2, which demonstrated that process energy consumption dominates the life cycle impacts, while agricultural contributions remain comparatively smaller. Slightly larger variations are observed for land-use and eutrophication-related indicators, reflecting their stronger dependence on agricultural modelling assumptions. Freshwater eutrophication and land use show the highest sensitivities, reaching 4.54% for Artichoke extract and 4.19% for Hawthorn extract, respectively. Nevertheless, even in these cases the variation remains moderate and does not alter the overall ranking or interpretation of the environmental profiles across the analyzed extracts. Across the different botanical species, the Artichoke and Hawthorn extracts show the highest sensitivity values, particularly in eutrophication and land-use categories, reflecting their relatively larger agricultural contributions compared with other extracts. Conversely, Lemon Balm extract exhibits almost negligible variation across all indicators, indicating minimal dependence of the results on the assumed adjustment factor. The sensitivity analysis confirms that the modelling assumption regarding the impacts of juvenile plant cultivation has a marginal influence on the overall environmental results and therefore does not affect the main conclusions of the study. The dominance structure identified in the contribution analysis remains unchanged under the tested sensitivity scenario, particularly the leading role of process energy consumption and auxiliary materials.
Sensitivity analysis results for the botanical extracts
| Impact category | Althea extract | Hawthorn extract | Artichoke extract | Grindelia extract | Lemon balm extract | Blueberry extract | Plantago extract | Plantago sol extract | Verbascum extract |
| Acidification | 0.34% | 0.99% | 0.34% | 1.39% | 0.00% | 0.00% | 1.10% | 1.47% | 1.44% |
| Climate change | 0.12% | 0.43% | 0.15% | 0.35% | 0.00% | 0.00% | 0.28% | 0.39% | 0.33% |
| Ecotoxicity freshwater | 0.15% | 1.13% | 0.78% | 0.88% | 0.02% | 0.00% | 0.63% | 0.92% | 1.00% |
| particulate matter | 0.15% | 0.47% | 0.15% | 0.95% | 0.00% | 0.00% | 0.74% | 1.02% | 0.95% |
| Eutrophication marine | 0.47% | 2.63% | 4.44% | 1.82% | 0.04% | 0.00% | 1.29% | 1.70% | 1.76% |
| Eutrophication freshwater | 0.40% | 4.00% | 4.54% | 1.31% | 0.12% | 0.00% | 2.62% | 3.12% | 1.58% |
| Eutrophication terrestrial | 0.54% | 1.31% | 0.55% | 1.79% | 0.01% | 0.00% | 1.44% | 1.85% | 1.93% |
| Human toxicity cancer | 0.07% | 0.26% | 0.04% | 0.30% | 0.00% | 0.00% | 0.55% | 0.77% | 0.32% |
| Human toxicity non-cancer | 0.23% | -0.22% | 0.01% | -0.30% | -0.09% | 0.00% | 0.50% | 0.73% | 0.00% |
| Ionizing radiation | 0.13% | 0.58% | 0.17% | 0.36% | 0.00% | 0.00% | 0.27% | 0.38% | 0.31% |
| Land use | 1.35% | 4.19% | 4.54% | 3.39% | 0.31% | 0.00% | 2.76% | 3.19% | 3.36% |
| Ozone depletion | 0.80% | 3.15% | 0.90% | 1.97% | 0.00% | 0.00% | 1.52% | 1.96% | 1.72% |
| Photochemical ozone formation | 0.29% | 1.15% | 0.37% | 0.85% | 0.00% | 0.00% | 0.62% | 0.90% | 0.77% |
| Resource use fossils | 0.10% | 0.41% | 0.11% | 0.28% | 0.00% | 0.00% | 0.21% | 0.31% | 0.25% |
| Resource use minerals and metals | 0.47% | 1.89% | 0.55% | 1.48% | 0.00% | 0.00% | 1.00% | 1.51% | 1.56% |
| Water use | 0.01% | 0.00% | 0.98% | 1.00% | 0.00% | 0.00% | 0.35% | 0.49% | 0.79% |
Study limitations and sources of uncertainty
Several limitations should be considered when interpreting the results. The database currently covers a limited number of botanical species and extraction technologies, reflecting data availability and the scope of participating suppliers. The extraction processes analyzed in this study represent the current industrial practices adopted by the company, which mainly rely on conventional solvent- or water-based extraction systems. Consequently, emerging “green extraction” technologies (e.g., ultrasound-, microwave-, or pulsed electric field-assisted extraction) were not included due to the lack of primary industrial data. Moreover, LCA studies have shown that the environmental performance of extraction technologies strongly depends on electricity consumption, solvent use, and extraction efficiency, meaning that technologies labelled as “green” do not necessarily lead to lower impacts under all conditions[20].
Although the foreground system was modelled using primary industrial data, background processes such as electricity supply, agricultural inputs, and solvent production rely on established secondary databases. As discussed in methodological LCA literature, background assumptions can significantly influence absolute impact values, particularly for energy-intensive systems[21]. Additional sources of uncertainty arise from allocation choices and operational variability. Differences in extraction yields, batch sizes, and auxiliary material recovery rates can affect results, especially when comparing across facilities or technologies. However, the consistent hotspot patterns observed across the analyzed extracts suggest that the main qualitative conclusions are robust, even if absolute values may vary within a reasonable range. Future studies could further quantify uncertainty by exploring alternative background datasets and regionalized electricity mixes.
Furthermore, the use of the AGRIBALYSE® blueberry dataset as a proxy for modelling the cultivation phase across all botanical species represents a potential source of bias, as it may not fully capture crop-specific differences in agronomic practices, input requirements, yields, and emission profiles. To mitigate this limitation, the dataset was adapted using primary, supplier-specific data (e.g., fertiliser use, water consumption, and yields), improving its representativeness. However, some residual uncertainty remains due to the use of a common modelling structure. As shown in the contribution analysis (Section 3.2), the cultivation phase accounts for a limited share of total impacts compared to industrial processing, therefore limiting the influence of this assumption on the study conclusions.
LCI data credibility and future perspectives
A key strength of this study lies in the use of primary, supplier-specific data, which improves representativeness compared with generic datasets. The consistent dominance of process energy consumption (67%-84%) across extracts supports the internal consistency of the dataset and indicates that the main impact drivers are robustly captured. By systematically structuring the inventory along the defined system boundary and documenting modelling assumptions, the database enhances traceability and reproducibility, addressing concerns frequently raised in reviews of nutraceutical LCAs[18]. However, uncertainties remain due to the use of secondary background data (e.g., electricity and auxiliaries) and variability in process configurations. As analyzed in Section 3.2, differences in recipe auxiliaries and supplier treatments are key sources of variability and warrant further investigation. Future research should expand the database to additional species, extraction technologies, and regions to improve representativeness.
CONCLUSION
This study develops a harmonized cradle-to-gate LCA framework based on primary industrial data for assessing the environmental performance of botanical extracts. The results provide a robust quantitative baseline, showing that climate change impacts of the assessed extracts range from 2.59 kg CO2-eq per kg to 3.33 kg CO2-eq per kg of dry extract. A consistent life-cycle structure was identified across all botanical species, with process energy consumption (electricity and thermal energy for extraction and concentration) emerging as the dominant contributor, accounting for 67%-84% of total climate change impacts. In contrast, upstream transportation was found to play a marginal role, accounting for less than 2% of the total greenhouse gas emissions.
These findings provide actionable insights for the nutraceutical industry. To achieve meaningful reductions in total environmental impacts, manufacturers should prioritize energy efficiency and the management of recipe auxiliaries and solvents, which can contribute up to approximately 14% of total impacts, rather than focusing primarily on transport distance reduction. Decarbonization efforts should be directed toward optimizing industrial processing stages and adopting energy-efficient technologies, as these stages represent the main environmental hotspots within the production chain. Furthermore, product-level validation demonstrated that downstream formulation and packaging choices can outweigh the environmental differences between individual extracts, highlighting the importance of an integrated eco-design approach. While this research provides a science-based foundation for sustainability reporting and procurement, future work should expand the database to additional species, extraction technologies, and geographical regions while further improving data representativeness to support more robust sustainability evaluation in nutraceutical supply chains.
DECLARATIONS
Acknowledgments
The authors gratefully acknowledge Kimberly Morales, a native English speaker from the United States with academic training at the University of Southern California, Tsinghua University, and the University of Padova, for her professional assistance in English language polishing and editorial refinement of this manuscript.
Authors’ contributions
Made substantial contributions to the conception and design of the study and performed data analysis and interpretation: Presta, S.; De Rigo, F.; Dandolo, R.; Manzardo, A.; Wu, J.
Performed data acquisition, as well as providing administrative, technical, and material support: Colella, M.; Zanatta, S.; Ghirardello, L.; Amadio, E.; Caco, C.; Gobbo, J.; Gammuto, M.; Bassetto, R.; Callegari, M.
Availability of data and materials
Data is available from the corresponding author upon reasonable request.
AI and AI-assisted tools statement
During the preparation of this manuscript, the AI tool ChatGPT (GPT-5.2, released 2025-12-11) was used solely for language editing. The tool did not influence the study design, data collection, analysis, interpretation, or the scientific content of the work. All authors take full responsibility for the accuracy, integrity, and final content of the manuscript.
Financial support and sponsorship
This work was supported by I-NEST INTERCONNECTED NORD-EST INNOVATION ECOSYSTEM from NextGenerationEU (CUP B73D24000090004).
Conflicts of interest
Colella, M.; Zanatta, S.; Ghirardello, L.; Amadio, E.; Caco, C.; Gobbo, J.; Gammuto, M.; Bassetto, R.; Callegari, M. are affiliated with Labomar S.p.A., while the other authors have declared that they have no conflicts of interest.
Ethical approval and consent to participate
Not applicable.
Consent for publication
Not applicable.
Copyright
© The Author(s) 2026.
REFERENCES
1. Schau, E. M.; Fet, A. M. LCA studies of food products as background for environmental product declarations. Int. J. Life. Cycle. Assess. 2008, 13, 255-64.
2. Notarnicola, B.; Salomone, R.; Petti, L.; Renzulli, P. A.; Roma, R.; Cerutti, A. K. Life cycle assessment in the agri-food sector: case studies, methodological issues and best practices. Springer International Publishing, 2015: Cham, Switzerland.
3. Wang, S.; Zhou, F.; Zhao, J.; et al. Mitigating overestimation in lithium-ion battery recycling LCA: the critical role of ex-post data and operational parameters. Chem. Eng. J. 2025, 521, 166261.
4. Suckling, J.; Brussino, G.; Koukouna, E.; et al. Environmental life cycle assessment of producing sorbitol and maltitol from wheat starch using process simulation: the SWEET project. J. Clean. Prod. 2025, 494, 144985.
5. ISO 14040:2006. Environmental management - life cycle assessment - principles and framework; Geneva, Switzerland, 2006. Available from: https://www.iso.org/standard/37456.html [Last accessed on 3 Jun 2026].
6. ISO 14044:2006. Environmental management - life cycle assessment - requirements and guidelines; Geneva, Switzerland, 2006. Available from: https://www.iso.org/standard/38498.html [Last accessed on 3 Jun 2026][.
7. Piron, M.; Wu, J.; Fedele, A.; Manzardo, A. Industry 4.0 and life cycle assessment: Evaluation of the technology applications as an asset for the life cycle inventory. Sci. Total. Environ. 2024, 916, 170263.
8. Pérez-lópez, P.; González-garcía, S.; Ulloa, R. G.; Sineiro, J.; Feijoo, G.; Moreira, M. T. Life cycle assessment of the production of bioactive compounds from tetraselmis suecica at pilot scale. J. Clean. Prod. 2014, 64, 323-31.
9. Pattara, C.; Salomone, R.; Cichelli, A. Carbon footprint of extra virgin olive oil: a comparative and driver analysis of different production processes in Centre Italy. J. Clean. Prod. 2016, 127, 533-47.
10. Emmenegger, M. F.; Délerce-Mauris, C.; Porté, C. Models integrated in Ecoinvent LCI calculation tool for crop production. Ecoinvent association, 2018. Available from: https://agritool.ecoinvent.org/Ecoinvent_Tool_Model_Description_20180130.pdf [Last accessed on 3 Jun 2026].
11. PRé Sustainability. SimaPro Life cycle assessment software (Version 10); PRé Sustainability: Amersfoort, The Netherlands, 2024. Available from: https://network.simapro.com/pre/ [Last accessed on 3 Jun 2026].
12. ADEME AGRIBALYSE® v3.1. AGRIBALYSE agricultural and food database. France, ADEME: 2023. Available from: https://simapro.com/products/agribalyse-agricultural-database/ [Last accessed on 8 Jun 2026].
13. Environmental footprint. Environmental footprint methods (EF 3.1): life cycle impact assessment methods. European Commission: Brussels, Belgium, 2021. Available from: https://eplca.jrc.ec.europa.eu/EnvironmentalFootprint.html [Last accessed on 3 Jun 2026].
14. Pappas, V. M.; Samanidis, I.; Stavropoulos, G.; et al. Analysis of five-extraction technologies’ environmental impact on the polyphenols production from moringa oleifera leaves using the life cycle assessment tool based on ISO 14040. Sustainability 2023, 15, 2328.
15. Baquero, G.; Sorolla, S.; Casas, C.; Bacardit, A. Life cycle assessment of polyphenolic extracts derived from pine by-products. Materials 2025, 18, 1000.
16. Mckuin, B.; Kapuscinski, A. R.; Sarker, P. K.; Cheek, N.; Lim, J.; Sabarsky, M. Comparative life cycle assessment of marine microalgae, Nannochloropsis sp. and fishmeal for sustainable protein ingredients in aquaculture feeds. Elem. Sci. Anth. 2023, 11, 00083.
17. Wu, J.; Zou, Y.; Liu, G.; et al. Reducing food loss and associated greenhouse gas emissions using a dynamic shelf life approach. Environ. Sci. Technol. 2025, 59, 13742-53.
18. Djekic, I.; Smigic, N.; Vitali, Čepo. D. A Systematic review of nutraceuticals from the perspective of life-cycle assessment. Pharmaceuticals 2025, 18, 1278.
19. Marco I, Riemma S, Iannone R. Life cycle assessment of supercritical CO2 extraction of caffeine from coffee beans. J. Supercrit. Fluids. 2018, 133, 393-400.
20. Chemat, F.; Abert-vian, M.; Fabiano-tixier, A. S.; et al. Green extraction of natural products. Origins, current status, and future challenges. TrAC. Trends. Anal. Chem. 2019, 118, 248-63.
Cite This Article
How to Cite
Download Citation
Export Citation File:
Type of Import
Tips on Downloading Citation
Citation Manager File Format
Type of Import
Direct Import: When the Direct Import option is selected (the default state), a dialogue box will give you the option to Save or Open the downloaded citation data. Choosing Open will either launch your citation manager or give you a choice of applications with which to use the metadata. The Save option saves the file locally for later use.
Indirect Import: When the Indirect Import option is selected, the metadata is displayed and may be copied and pasted as needed.
About This Article
Copyright

Data & Comments
Data
0


Comments
Comments must be written in English. Spam, offensive content, impersonation, and private information will not be permitted. If any comment is reported and identified as inappropriate content by OAE staff, the comment will be removed without notice. If you have any queries or need any help, please contact us at support@oaepublish.com.