


Molecular characteristics of fatty acid metabolic reprogramming in hepatocellular carcinoma and their implications for immunotherapy
 0
0 Abstract
Aim: Aberrant metabolism represents a hallmark feature of malignancies, which is crucial for facilitating adenosine triphosphate (ATP) production and biosynthesis of macromolecules that sustain cell proliferation, differentiation, and survival. In the context of tumorigenesis, fatty acids (FAs) have garnered substantial attention due to their dual role as secondary messengers and energy substrates. Notably, the pivotal role of FA metabolism in hepatocellular carcinoma (HCC) progression has been extensively explored. Therefore, this study aims to investigate the contributions of FA metabolism in the immunotherapy of HCC, which remain undefined.
Methods: We analyzed messenger RNA expression and genetic alterations of regulators of FA metabolism from public HCC datasets. Based on their FA metabolism profiles, patients were classified into two distinct molecular subtypes: cluster A and cluster B. Using subtype-derived differentially expressed genes, we established an unsupervised FA_score algorithm. Immune infiltration analysis and prognostic screening of 2,484 immune genes were integrated to develop a risk model, ultimately classifying patients into four integrated subtypes: mixed index (MI)-1 to MI-4.
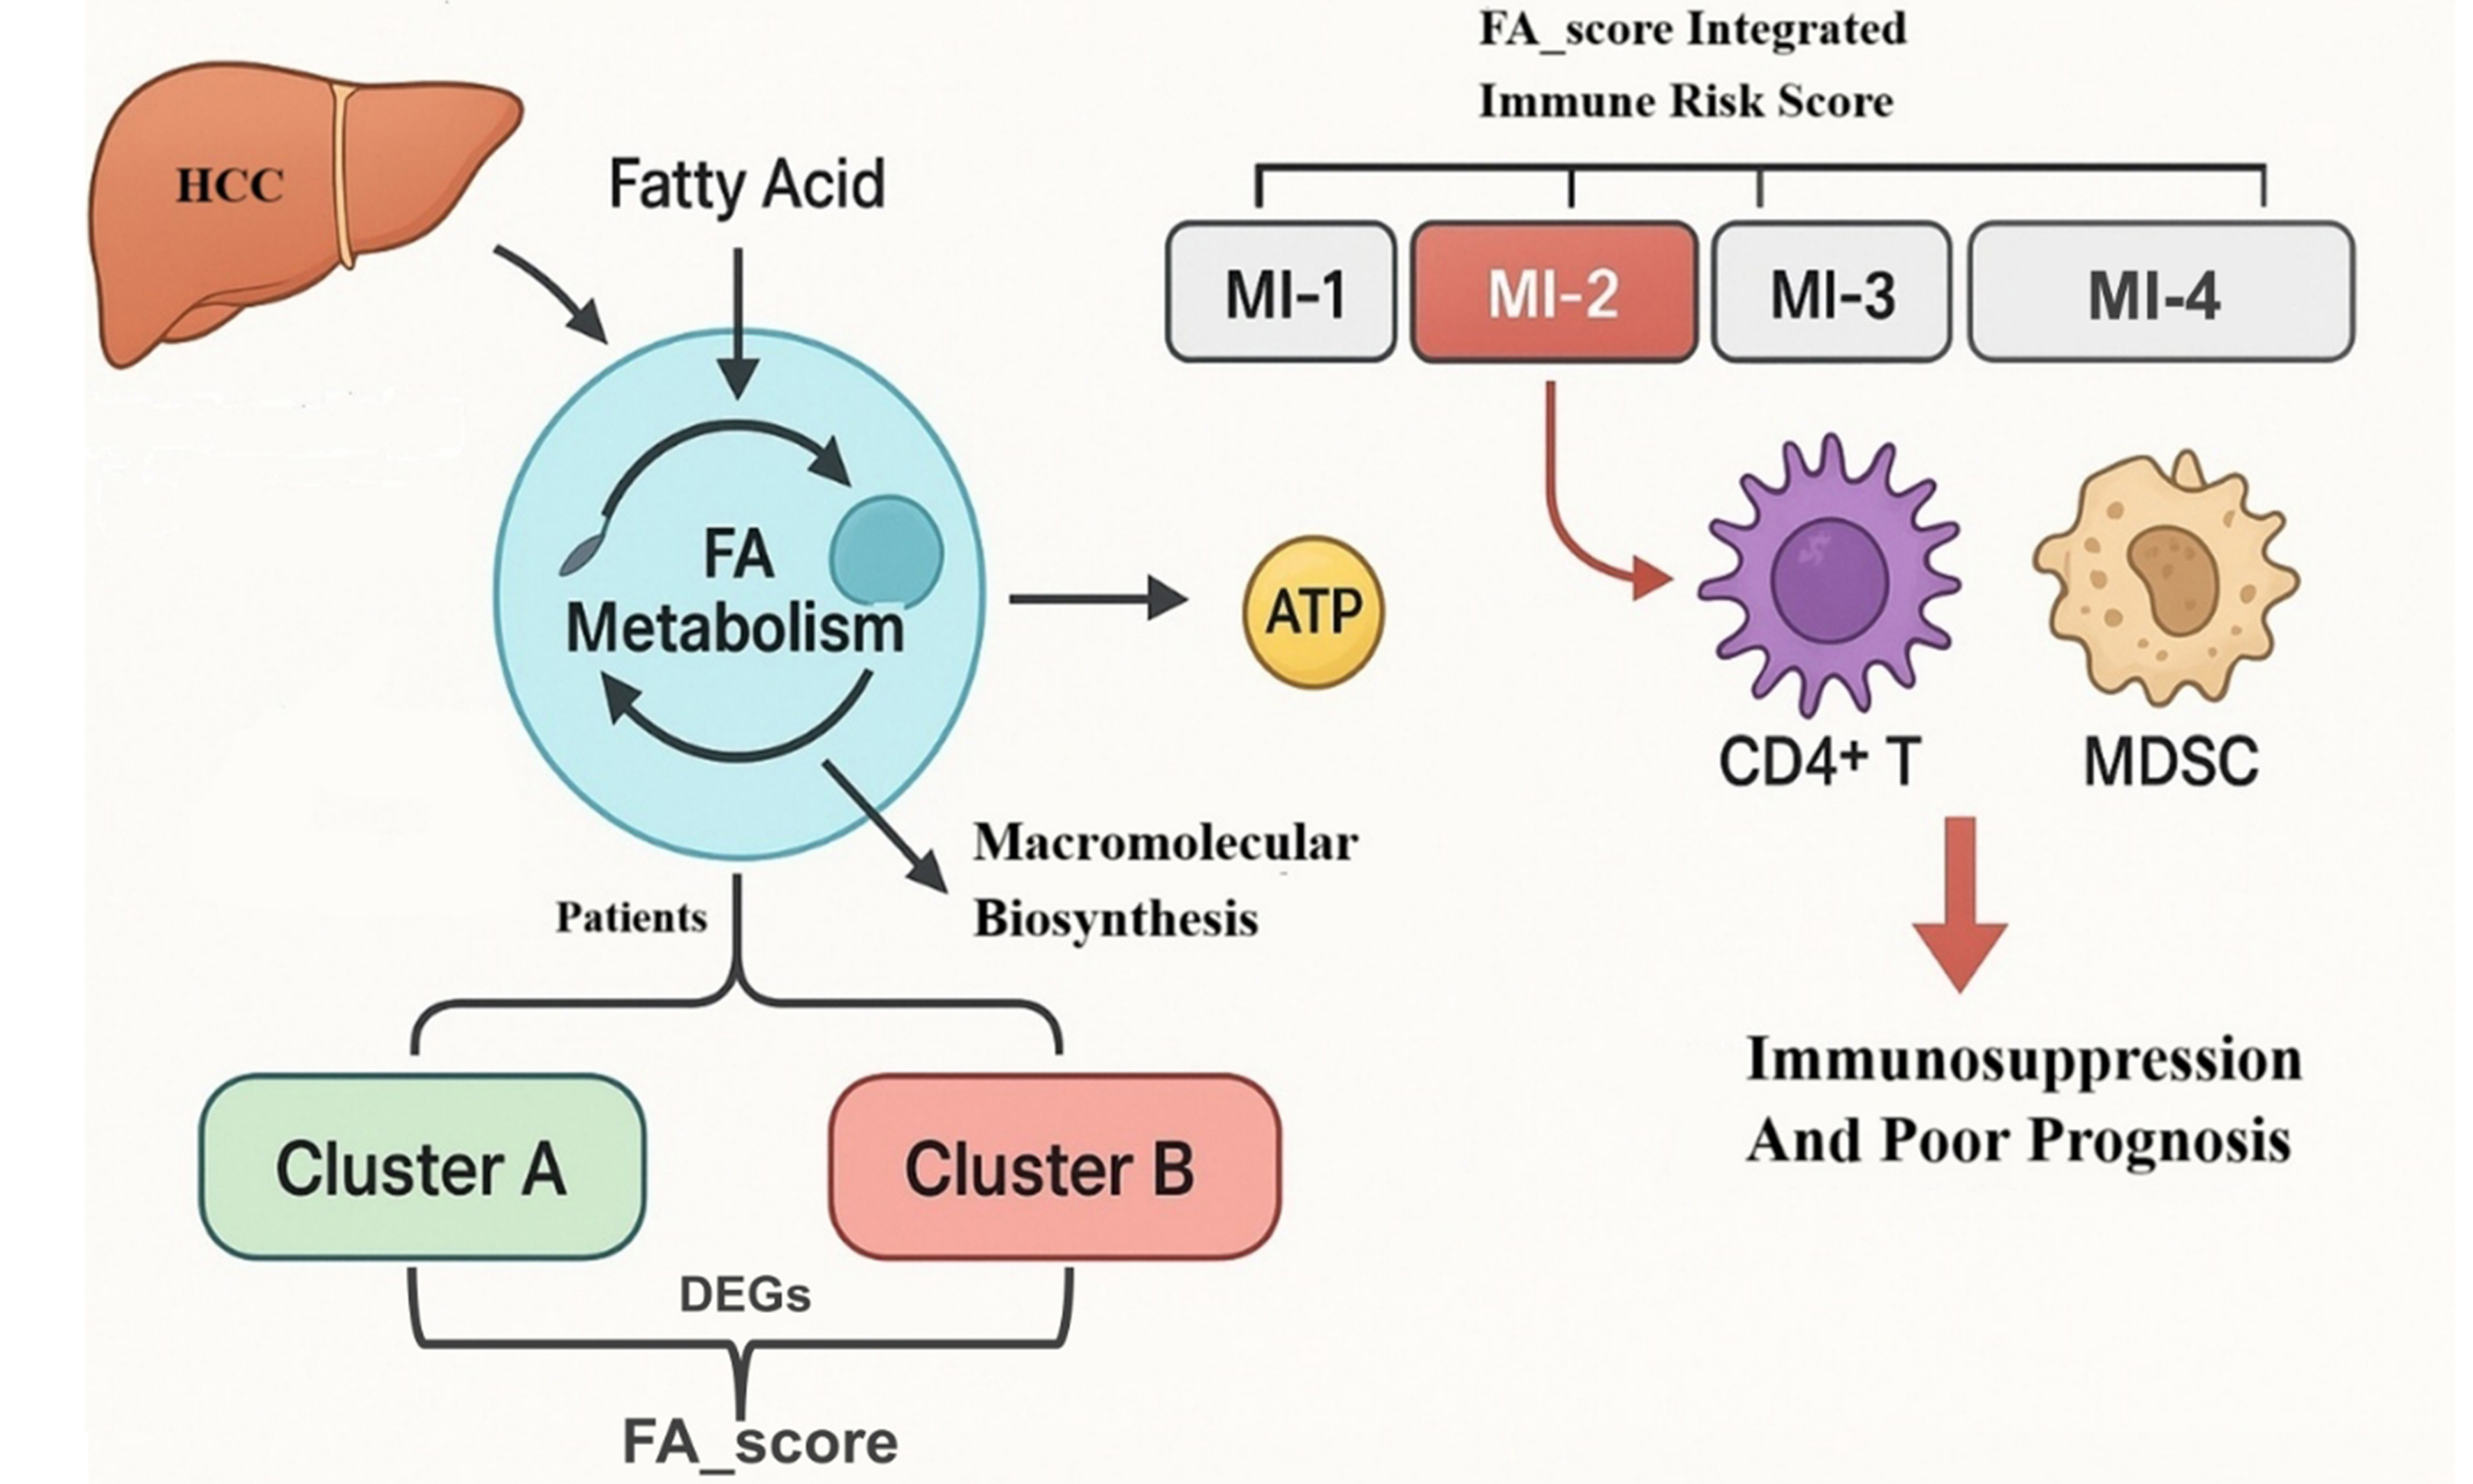
Result: Cluster B exhibited significantly worse overall survival than cluster A. Higher FA_score correlated with shorter survival and increased infiltration of immunosuppressive cells. The MI-2 subgroup showed abundant CD4+ T cells, myeloid-derived suppressor cells, and regulatory T cells, indicating strong immunosuppression and poor prognosis, suggesting limited benefit from immunotherapy.
Conclusion: We developed a novel classification system integrating FA metabolism and immune features. The MI-2 subtype is characterized by immunosuppression and poor outcomes, highlighting the clinical relevance of FA metabolic patterns in shaping the immune microenvironment and guiding personalized treatment in HCC.
Keywords
INTRODUCTION
In recent years, numerous studies have highlighted the substantial energetic demands associated with the hallmarks of malignancy, characterized by relentless cellular growth, proliferation, and evasion of cell death[1-4]. It is well-established that the intrinsic metabolism of tumor cells contributes significantly to reprogramming the tumor microenvironment (TME)[5-8]. However, the specific impact of aberrant metabolism on infiltrated immune cells remains poorly understood. Growing evidence indicates that the interaction between nutrients, metabolites, and immune cells plays a vital role in immune modulation and evasion in cancer[9-11].
Fatty acids (FAs), as major components of various species, including phospholipids, sphingolipids, and triglycerides, have emerged as novel therapeutic targets in numerous types of malignancies[12-15]. FAs consist of a carboxyl group and a hydrocarbon chain that varies in length and saturation. They are integral to both anabolic and catabolic metabolic processes, essential for maintaining energy homeostasis[16-18]. FA synthesis facilitates the conversion of diverse nutrients into metabolic intermediates, which are widely utilized in a myriad of biochemical processes such as maintaining cell membrane structure and function, energy storage, and regulation of signaling pathways[19-21]. Moreover, cancer cells maintain altered FA metabolism within the dynamic TME, relying on genomic adaptations to support tumorigenesis and cancer progression[22]. Upregulated Phosphoinositide 3-Kinase (PI3K) signaling induces the activation of Mechanistic Target of Rapamycin Complex 1 (mTORC1), emerging as a critical mediator of FA metabolism in cancer cells. Additionally, under hypoxic conditions, PI3K-Protein Kinase B (AKT) activation induces COX-2 expression, leading to increased conversion of FAs to Prostaglandin E2 (PGE2), thereby stimulating tumor angiogenesis and immune cell recruitment in a Vascular Endothelial Growth Factor (VEGF)- and C-X-C Motif Chemokine Ligand 1 (CXCL1)-dependent manner[23-25]. Exploring the underlying mechanisms of aberrant FA metabolism provides valuable insights into metabolic dependencies, which could serve as potential therapeutic targets for cancer treatment.
Hepatocellular carcinoma (HCC) is the sixth most commonly diagnosed cancer and the fourth leading cause of cancer-related deaths globally[26,27]. The progression of HCC is featured by diverse genetic variations, biochemical aberrations, and molecular biological alterations[26-28]. Growing evidence has revealed the significance of metabolic reprogramming in providing the biological macromolecules necessary for HCC pathogenesis. The Warburg effect, a key component of the complex metabolic adaptations in tumor cells that promotes aerobic glycolysis, has been widely investigated for its contribution to HCC cell proliferation[29]. Furthermore, dysregulation of glycolytic enzymes such as Hexokinase 2 (HK2), Glucose Transporters (GLUTs), and Pyruvate Kinase M2 (PKM2) has been observed in HCC, correlating with an unfavorable prognosis for patients[30-32]. Clinical studies also established an increased incidence of HCC in cohorts with metabolic dysfunction-associated steatotic liver disease [MASLD; formerly nonalcoholic fatty liver disease (NAFLD)], underscoring the essential role of FA metabolism in HCC progression. Notably, elevated expression of FA synthesis and oxidation enzymes, including Adipose Triglyceride Lipase (ATGL), Acetyl-CoA Carboxylase 1 (ACC1), and Carnitine Palmitoyltransferase 1 (CPT1), has been identified in HCC tumor tissues[33-35]. Nevertheless, the precise functions of FA metabolism in the TME of HCC remain poorly elucidated. Therefore, elucidating whether the intricate interplay of multiple regulators of FA metabolism influences the TME will shed light on novel immune-mediated mechanisms underlying HCC pathogenesis.
This study involved a thorough examination of genomic modifications and expression profiles of regulators of FA metabolism in samples of HCC through the utilization of the Gene Expression Omnibus (GEO) and The Cancer Genome Atlas (TCGA) databases. Furthermore, we demonstrated the utility of FA metabolism clustering and FA_score as quantitative measures to assess the efficacy of FA metabolic reprogramming in individual patients. Subsequently, we identified key immune-regulatory genes with prognostic value and developed a new risk model for HCC prognosis using these genes. Integration of the FA clustering system with this model revealed four distinct subtypes [mixed index (MI)-1/2/3/4] among HCC patients. Importantly, our findings revealed an increased presence of CD4+ T cells, myeloid-derived suppressor cells (MDSCs), and regulatory T cells (Tregs) in the MI cluster-2 cohort, which was associated with reduced immunotherapy response and poorer overall survival (OS). These results shed light on the complex interplay between FA metabolism and immune responses in HCC, emphasizing the potential implications for personalized treatment strategies.
METHODS
Data source
Using the UCSC XENA browser (https://xenabrowser.net/), we downloaded the RNA sequencing (RNA-seq), clinical, and somatic mutation data correlated with HCC from the TCGA database. Two RNA-seq profiles (GSE45114 and GSE76427) were selected from the GEO database. All the data we used in this study were openly accessed.
Data preprocessing
The expression profiles of HCC samples were obtained from the TCGA and GEO databases. RNA-seq data from different platforms were pre-processed for subsequent studies. All null gene test values were filtered out from the microarray probes, and the gene expression of each patient was transformed using log2. The remaining probes were then aligned to human genes, and all genes were annotated using PubMed gene symbols. Tumor samples from TCGA without clinical data, along with normal tissue samples, were initially excluded. Additionally, genes with a fragment per kilobase million (FPKM) of 0 in more than 50% of the samples were removed. Finally, an HCC gene array including 507 cases was established for subsequent analysis.
Clustering expression pattern of FA metabolism-associated regulators
Aiming to evaluate the regulators of FA metabolism in HCC specimens from TCGA and the GEO database, we carried out an unsupervised clustering analysis. Based on the “KEGG_FATTY_ACID_METABOLISM” gene set, a total of 42 FA metabolic regulatory factors were obtained. Unsupervised clustering was then applied to identify robust clusters of HCC tumor specimens. These steps were repeated 1,000 times using the ConsensusClusterPlus package to ensure the stability of the classification.
Analysis of immune cell characteristics
In this study, we utilized single-sample Gene Set Enrichment Analysis (ssGSEA) and the CIBERSORT (Cell-type Identification By Estimating Relative Subsets of RNA Transcripts) algorithm to validate the immune cell infiltration levels in HCC samples. And the detailed methods were presented as follows.
ssGSEA
The relative proportions of 22 immune cell types were further quantified using CIBERSORT with 1,000 permutations and the LM22 signature matrix. To ensure robustness, all expression datasets were pre-processed using quantile normalization, as recommended for mixed-platform analyses. Batch effects between TCGA and GEO cohorts were corrected using ComBat before deconvolution. Only samples with CIBERSORT P < 0.05 were included, indicating reliable deconvolution accuracy. The inferred immune fractions were normalized to sum to 1 within each sample, allowing direct comparison across datasets. The rationale for combining ssGSEA and CIBERSORT is that ssGSEA provides stable enrichment scores for heterogeneous datasets, while CIBERSORT enables absolute fraction estimation with statistical confidence, offering complementary perspectives for immune infiltration assessment.
CIBERSORT
The relative abundance of the 22 Tumor-Infiltrating Immune Cells (TIICs) in each sample was assessed using the “CIBERSORT” tool (R package). We calculated the infiltration level of 22 types of TIICs in each HCC sample tissue. Cases with a CIBERSORT output of P < 0.05, indicating that the inferred fractions of immune cell populations produced by CIBERSORT are accurate, were considered to be eligible for further analysis. For each sample, the final CIBERSORT output estimates were normalized to sum up to one and thus can be interpreted directly as cell fractions for comparison across different immune cell types and datasets.
GSEA
To examine Kyoto Encyclopedia of Genes and Genomes (KEGG) pathway enrichment, gene set enrichment analysis (GSEA) was performed using molecular signatures from the Molecular Signatures Database (MSigDB, v7.x). Genes were ranked based on the signal-to-noise ratio, and 1,000 permutations were used to assess significance. We adopted the standard GSEA significance thresholds [nominal P < 0.05, False Discovery Rate (FDR) < 0.25] according to the original GSEA guidelines, suitable for exploratory functional analyses.
To examine the enrichment of genes with significant expression-methylation correlations, DAVID v6.7 (https://david.ncifcrf.gov/) was used with gene lists defined by the 25% and 75% quantile cutoffs of correlation coefficients, providing an unbiased and reproducible threshold for identifying high-correlation groups.
Gene Ontology and KEGG pathway analysis of differentially expressed genes
To functionally characterize gene sets, we performed Gene Ontology (GO) analysis, which classifies genes into the biological process (BP), molecular function (MF), and cellular component (CC) domains.
The KEGG database serves as a comprehensive resource that integrates genomic, chemical, and systemic functional information. GO and KEGG pathway enrichment analyses for the differentially expressed genes (DEGs) were performed employing the DAVID database, with the significance threshold set at P < 0.01 and a minimum gene count of 10.
Weighted gene co-expression network construction
The Weighted Gene Co-expression Network Analysis (WGCNA) R package was used to construct weighted gene co-expression networks. Prior to network construction, Genes with low variance (< 25% quantile) or excessive missing values were removed. Outlier samples were identified via hierarchical clustering and excluded if their standardized connectivity Z-scores < -2. Batch effects across TCGA and GEO were corrected using ComBat. The soft-thresholding power β was determined using the scale-free topology criterion (coefficient of determination, R2 > 0.85) to ensure the network’s biological relevance. The adjacency matrix was converted into a topological overlap matrix (TOM), followed by average linkage hierarchical clustering. Modules were identified using the dynamic tree cut algorithm, with a minimum of 40 genes per module, adhering to standard parameters that balance sensitivity and module stability. The relationship between module eigengenes and clinical traits was analyzed to identify relevant modules. Hub genes in key modules were selected based on module membership (MM > 0.8) and gene significance (GS > 0.2).
Constructing the FA scoring system to evaluate individual HCC cases
(1) Firstly, we sought to identify FA metabolism cluster-associated DEGs. Before linear modeling, the limma R package estimated the mean-variance relationship by transforming raw read count data to log2 FPKM, thereby determining the weight of each observed value, and applied the voom function (variance modeling at the observational level). These data were then used in the linear modeling process. DEGs between RNA modification patterns were analyzed using empirical Bayesian statistics. A univariate Cox regression model was applied to calculate the hazard ratio (HR) for each DEG. Survival-related DEGs were subsequently extracted to construct the scoring system.
(2) Then, we carried out the enrichment analysis of these FA cluster-associated DEGs. The R package Clusterprofiler was used for enrichment analysis and functional annotation of DEGs. Utilizing “org.hs.eg DB” as the annotation function tool, GO and KEGG were enriched and analyzed in gene sets. With DEGs as the input gene set, the P value was calculated by ORA (Overrepresentation Analysis). Benjamini and Hochberg’s Adjustment for FDR was adopted. FDR < 0.05 was considered.
(3) In the final step, we developed the FA scoring system. After determining the prognostic significance of each gene trait score, we applied a method analogous to Granule-Granule Interaction (GGI) to compute the FA_score for each HCC patient: FA_score = Σ (βᵢ × Expᵢ), where βᵢ represents the regression coefficient, and Expᵢ refers to the gene expression level of each FA cluster-related DEG.
Statistical analysis
Spearman and distance correlation methods were used to calculate the correlation coefficient of the expression of RNA modification regulators. And we performed the Wilcoxon test to compare differences. The receiver operating characteristic (ROC) curve was further employed to evaluate the model’s validity.
To determine the prognostic FA_score threshold based on its association with patient survival, we identified the optimal cutoff for each dataset using the “SurvMiner” R package. The “SURV-Cutpoint” function was applied for dichotomizing FA_score, and all potential cut points were tested using the ED method to obtain the maximum rank statistic. Subsequently, patients were classified into high and low FA_score groups based on the highest log-rank statistic to improve computational efficiency in batch processing. The Kaplan-Meier method was used to generate survival curves for prognostic analysis, and the log-rank test was used to determine the significance of the differences. The HR for the DEGs and FA metabolism regulatory factors was computed using a univariate Cox regression model. Two-tailed tests were applied for all statistical analyses, with P < 0.05 regarded as statistically significant.
RESULTS
Validation of the genomic characteristics of FA-related regulators within HCC
According to the GSEA database, a total of 42 FA metabolism mediators were selected in this study [Supplementary Table 1]. Using HCC RNA-seq data from TCGA, we assessed the messenger RNA expression of these genes in both HCC and adjacent non-cancerous tissues [Figure 1A]. Then, we estimated the chromosomal gains and losses distribution of these Regulators of FA metabolism in the HCC cohort through analyzing copy number variations (CNVs) obtained from TCGA. As presented in Figure 1B and C, there were significant proportions of chromosomal gains in ALDH9A1 (Aldehyde Dehydrogenase 9 Family Member A1), ACOX1, ECI2, CPT1A, and EHHADH (Enoyl-CoA Hydratase And 3-Hydroxyacyl CoA Dehydrogenase). The high frequency of losses was demonstrated in the chromosomes of ACSL1, ACAT2, and ACADVL in tumor samples. Consistently, we also validated the genomic mutation status of these 42 Regulators of FA metabolism in HCC tissues. It was observed that ACAT2, CYP4A22, Alcohol Dehydrogenase 1B (ADH1B), ADH4, EHHADH, and HADHB (hydroacyl-CoA dehydrogenase-β) presented a high mutation frequency among HCC cases. The most common alteration types within these highly variable genes were missense mutations [Figure 1D]. Subsequently, we conducted the integrative analysis to discover the genetic variants in HCC [Supplementary Figure 1]. Our results indicated that Tumor Protein p53 (TP53) was the top mutated gene. Interestingly, when we divided the HCC cases into TP53 wild-type and mutation groups, most of the FA-correlated mediators exhibited differential expression between these two cohorts [Figure 1E]. Initial assessments revealed heterogeneous alterations of FA-associated regulators in HCC. Based on these findings, we subsequently aimed to construct a novel clustering system.
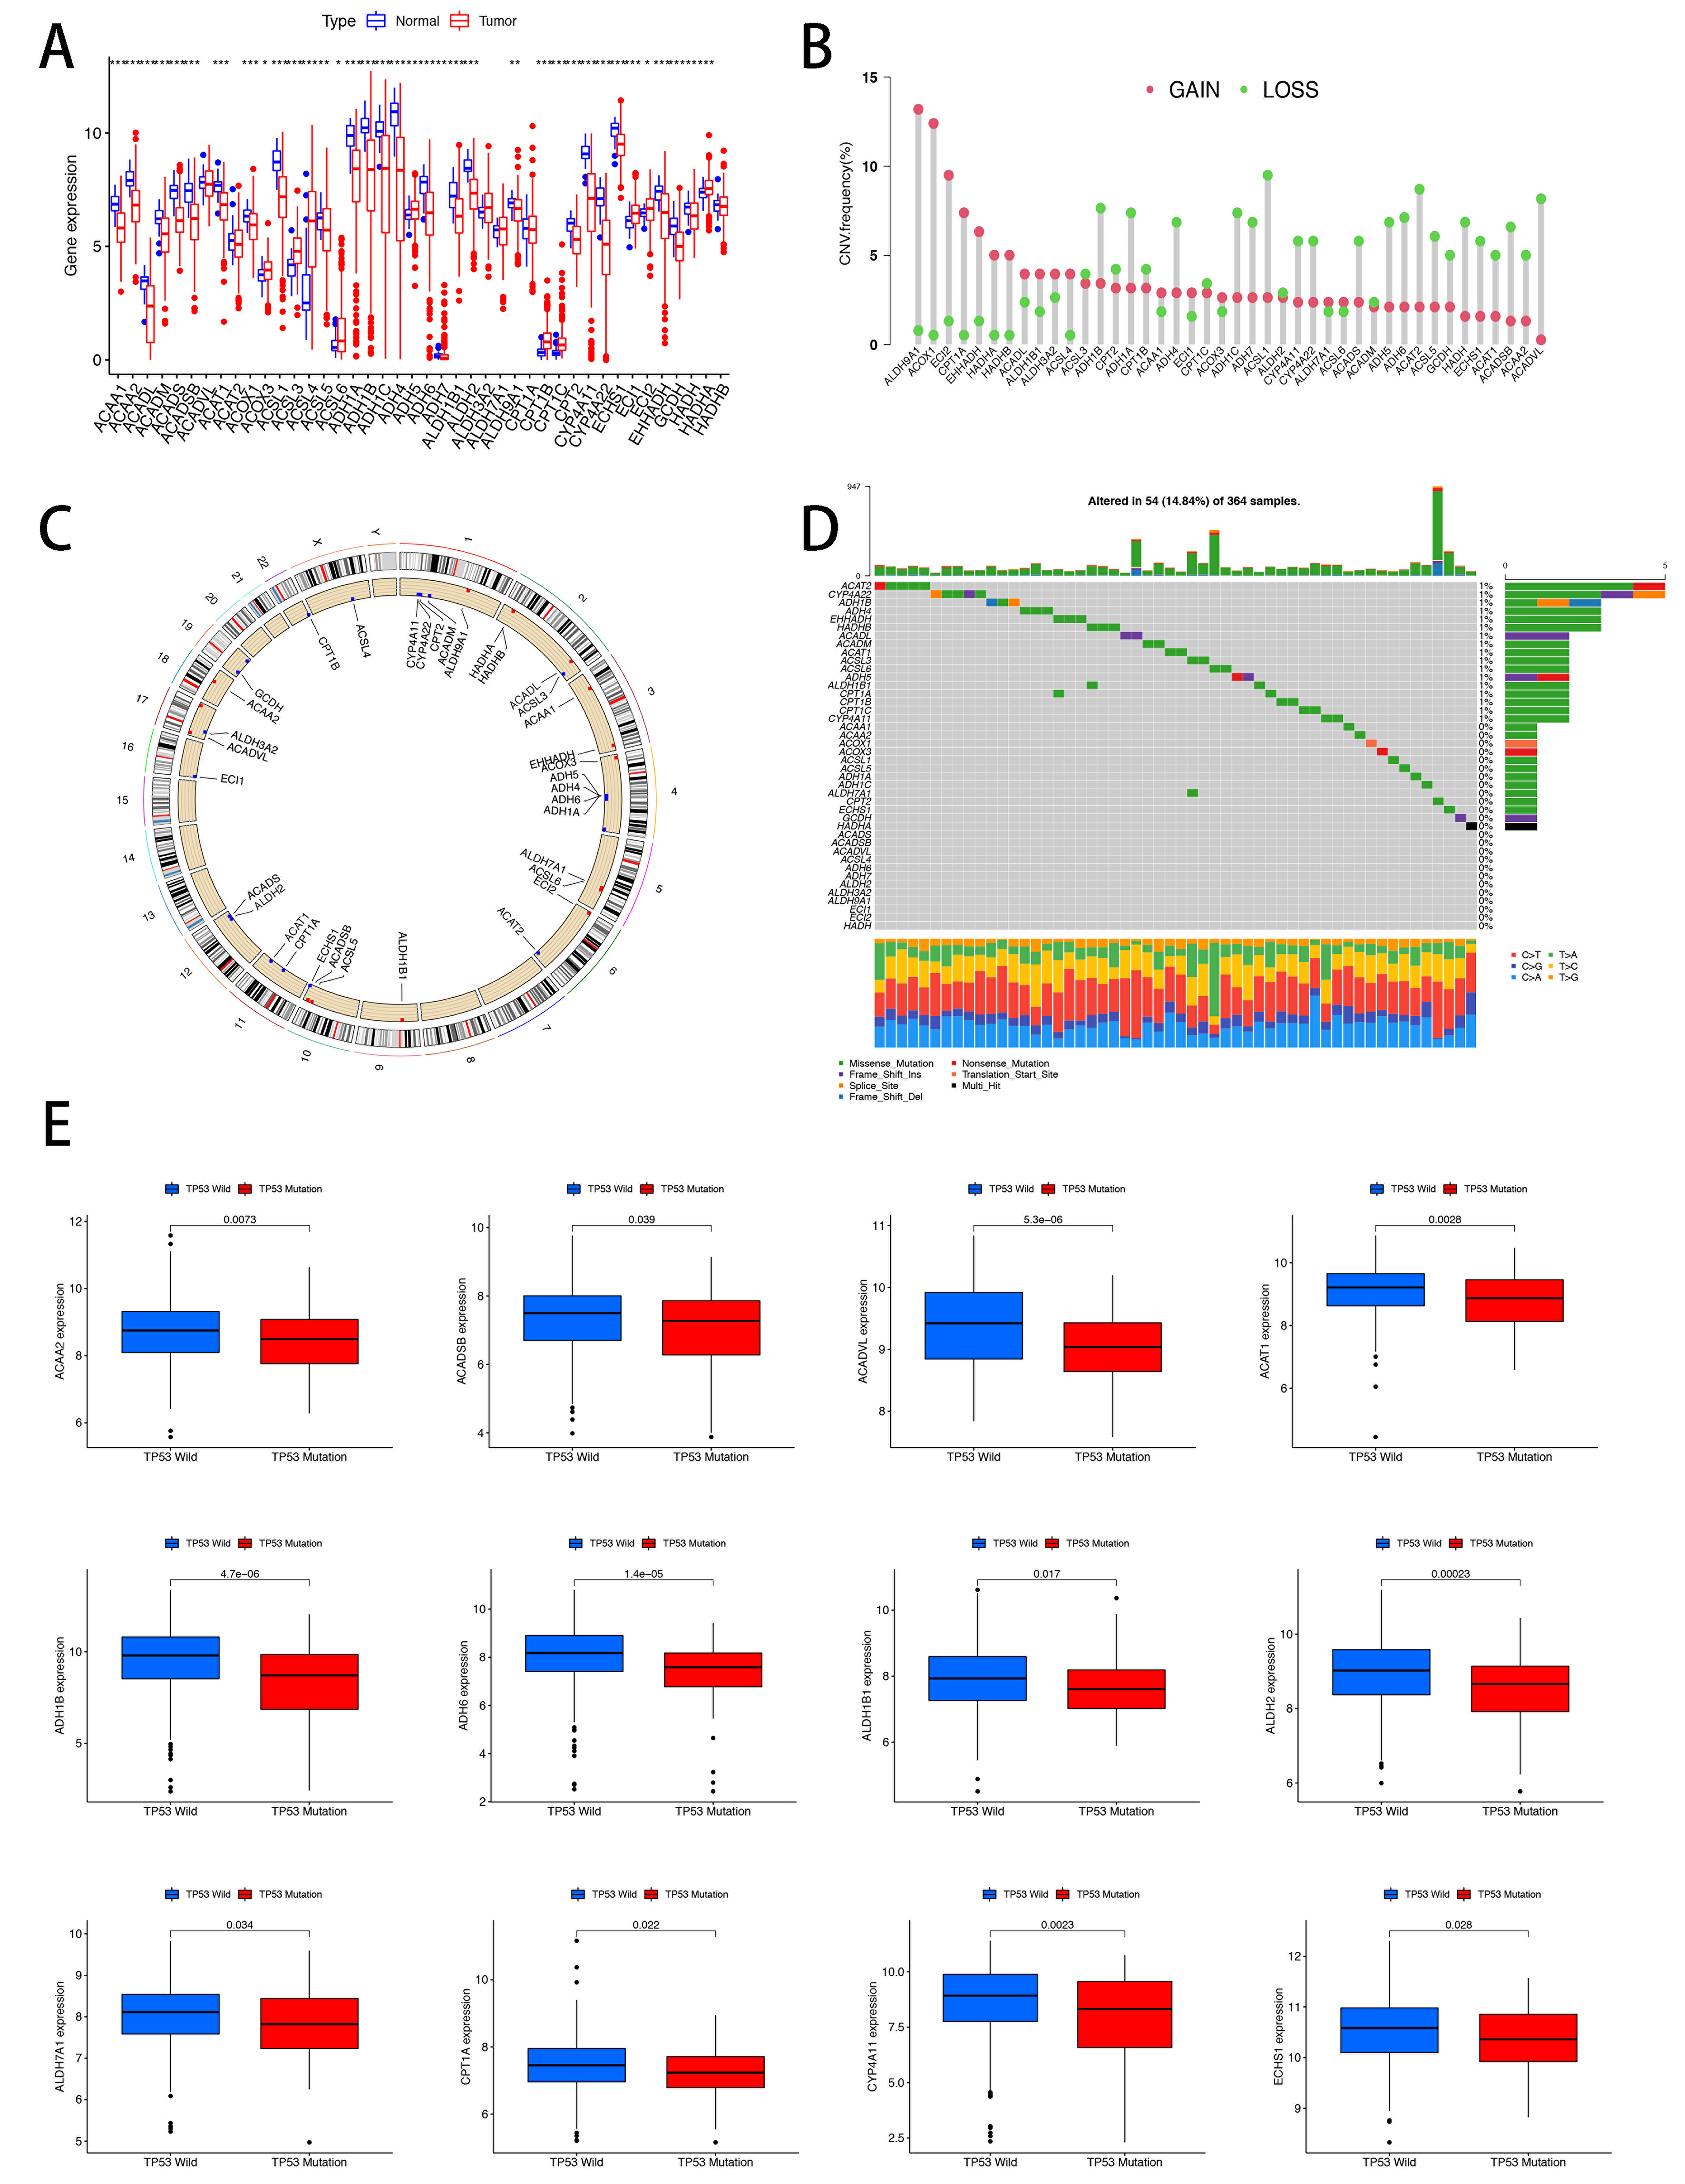
Figure 1. Expression patterns of FA metabolism-associated regulators in HCC. (A) Boxplots showing expression levels of 42 FA metabolism regulators in HCC specimens and noncancerous counterparts. Statistical significance was assessed using the Wilcoxon rank-sum test; (B and C) CNV analysis of HCC samples from TCGA showing gains in ALDH9A1, ACOX1, ECI2, CPT1A, and EHHADH, and frequent losses in ACSL1, ACAT2, and ACADVL; (D) Genomic mutation status of 42 FA metabolism regulators in HCC samples; (E) Expression changes of 12 FA metabolism regulators following TP53 mutation. *P < 0.05; **P < 0.01; ***P < 0.001. FA: Fatty acid; HCC: hepatocellular carcinoma; CNV: copy number variation; TCGA: The Cancer Genome Atlas; TP53: tumor protein p53.
Correlation between the regulators of FA metabolism and TME in HCC
Based on previous studies, FA metabolism reprogramming was shown to be essential for the OS of various cancers. Therefore, we aimed to investigate the correlation between regulators of FA metabolism and prognosis in the HCC cohort. Through multivariate analysis, nine genes were found to be associated with OS in HCC patients: ACSL3, ADH5, ADH7, ALDH3A2, ALDH9A1, HADHA, HADHB, and ACADM. [Supplementary Figure 2A]. Utilizing the TCGA and GEO datasets (GSE45114 and GSE76427), the Kaplan-Meier analysis was carried out to explore the prognosis-relevant FA metabolism mediators in HCC.
Seventeen genes associated with the OS of HCC patients were identified. High expression of ACADS, ACADSB, ACADVL, ALDH7A1, ACAT1, CYP4A11, ADH1B, ADH6, EHHADH, ADH7, ALDH1B1, ALDH2, and GCDH was found to be indicative of better prognosis, whereas increased levels of ACADM, ACSL3, ADH5, and HADHA were correlated with a worse prognosis. These findings suggest that FA-associated regulators may serve as indicators of OS in HCC patients [Supplementary Figure 2B].
The accumulating evidence has implied that the role of FAs is as essential mediators of cancer progression through remodeling the TME. To further estimate the FA metabolism contributing to the immune cell infiltration, we initially performed unsupervised clustering analyses based on the 42 FA metabolism mediators. Through the cumulative distribution function (CDF) algorithm, HCC cases were classified into two genomic subtypes: FA_cluster_A and FA_cluster_B [Figure 2A]. The distributions of these FA metabolic regulatory genes in FA_clusters were visualized by a heatmap. As shown in Figure 2B, most of the regulators were overexpressed in FA_cluster_A as compared to FA_cluster_B. According to the PCA results, we further confirmed that HCC patients in the two clusters were properly separated into independent subtypes [Supplementary Figure 3A]. Additionally, patients in FA_cluster_A exhibited longer OS compared with those in FA_cluster_B (Figure 2C, P = 0.026). Consistent with the CIBERSORT calculation, we tried to evaluate the infiltration levels of each immune cell in these two FA clusters. Compared with cluster_A, activated B cells, activated CD4+ T cells, MDSCs, macrophages, and Tregs were highly recruited in cluster_B [Figure 2D]. Taken together, we considered that FA metabolism reprogramming could potentially influence the prognosis and immune cell infiltration across different clusters in HCC. Due to the selection criteria [P < 0.05, |log fold change (FC)| 2], 1456 DEGs were explored between FA_cluster A and cluster B [Supplementary Figure 3B]. The subsequent GO analysis indicated that DEGs were correlated to the mitochondrial matrix, enzyme inhibitor activity, and extracellular matrix [Supplementary Figure 3C]. Moreover, it was identified that these DEGs were enriched in the PI3K-AKT signaling pathway, papillomavirus infection, T-cell leukemia infection, and lipid and atherosclerosis upon the KEGG analysis [Supplementary Figure 3D].
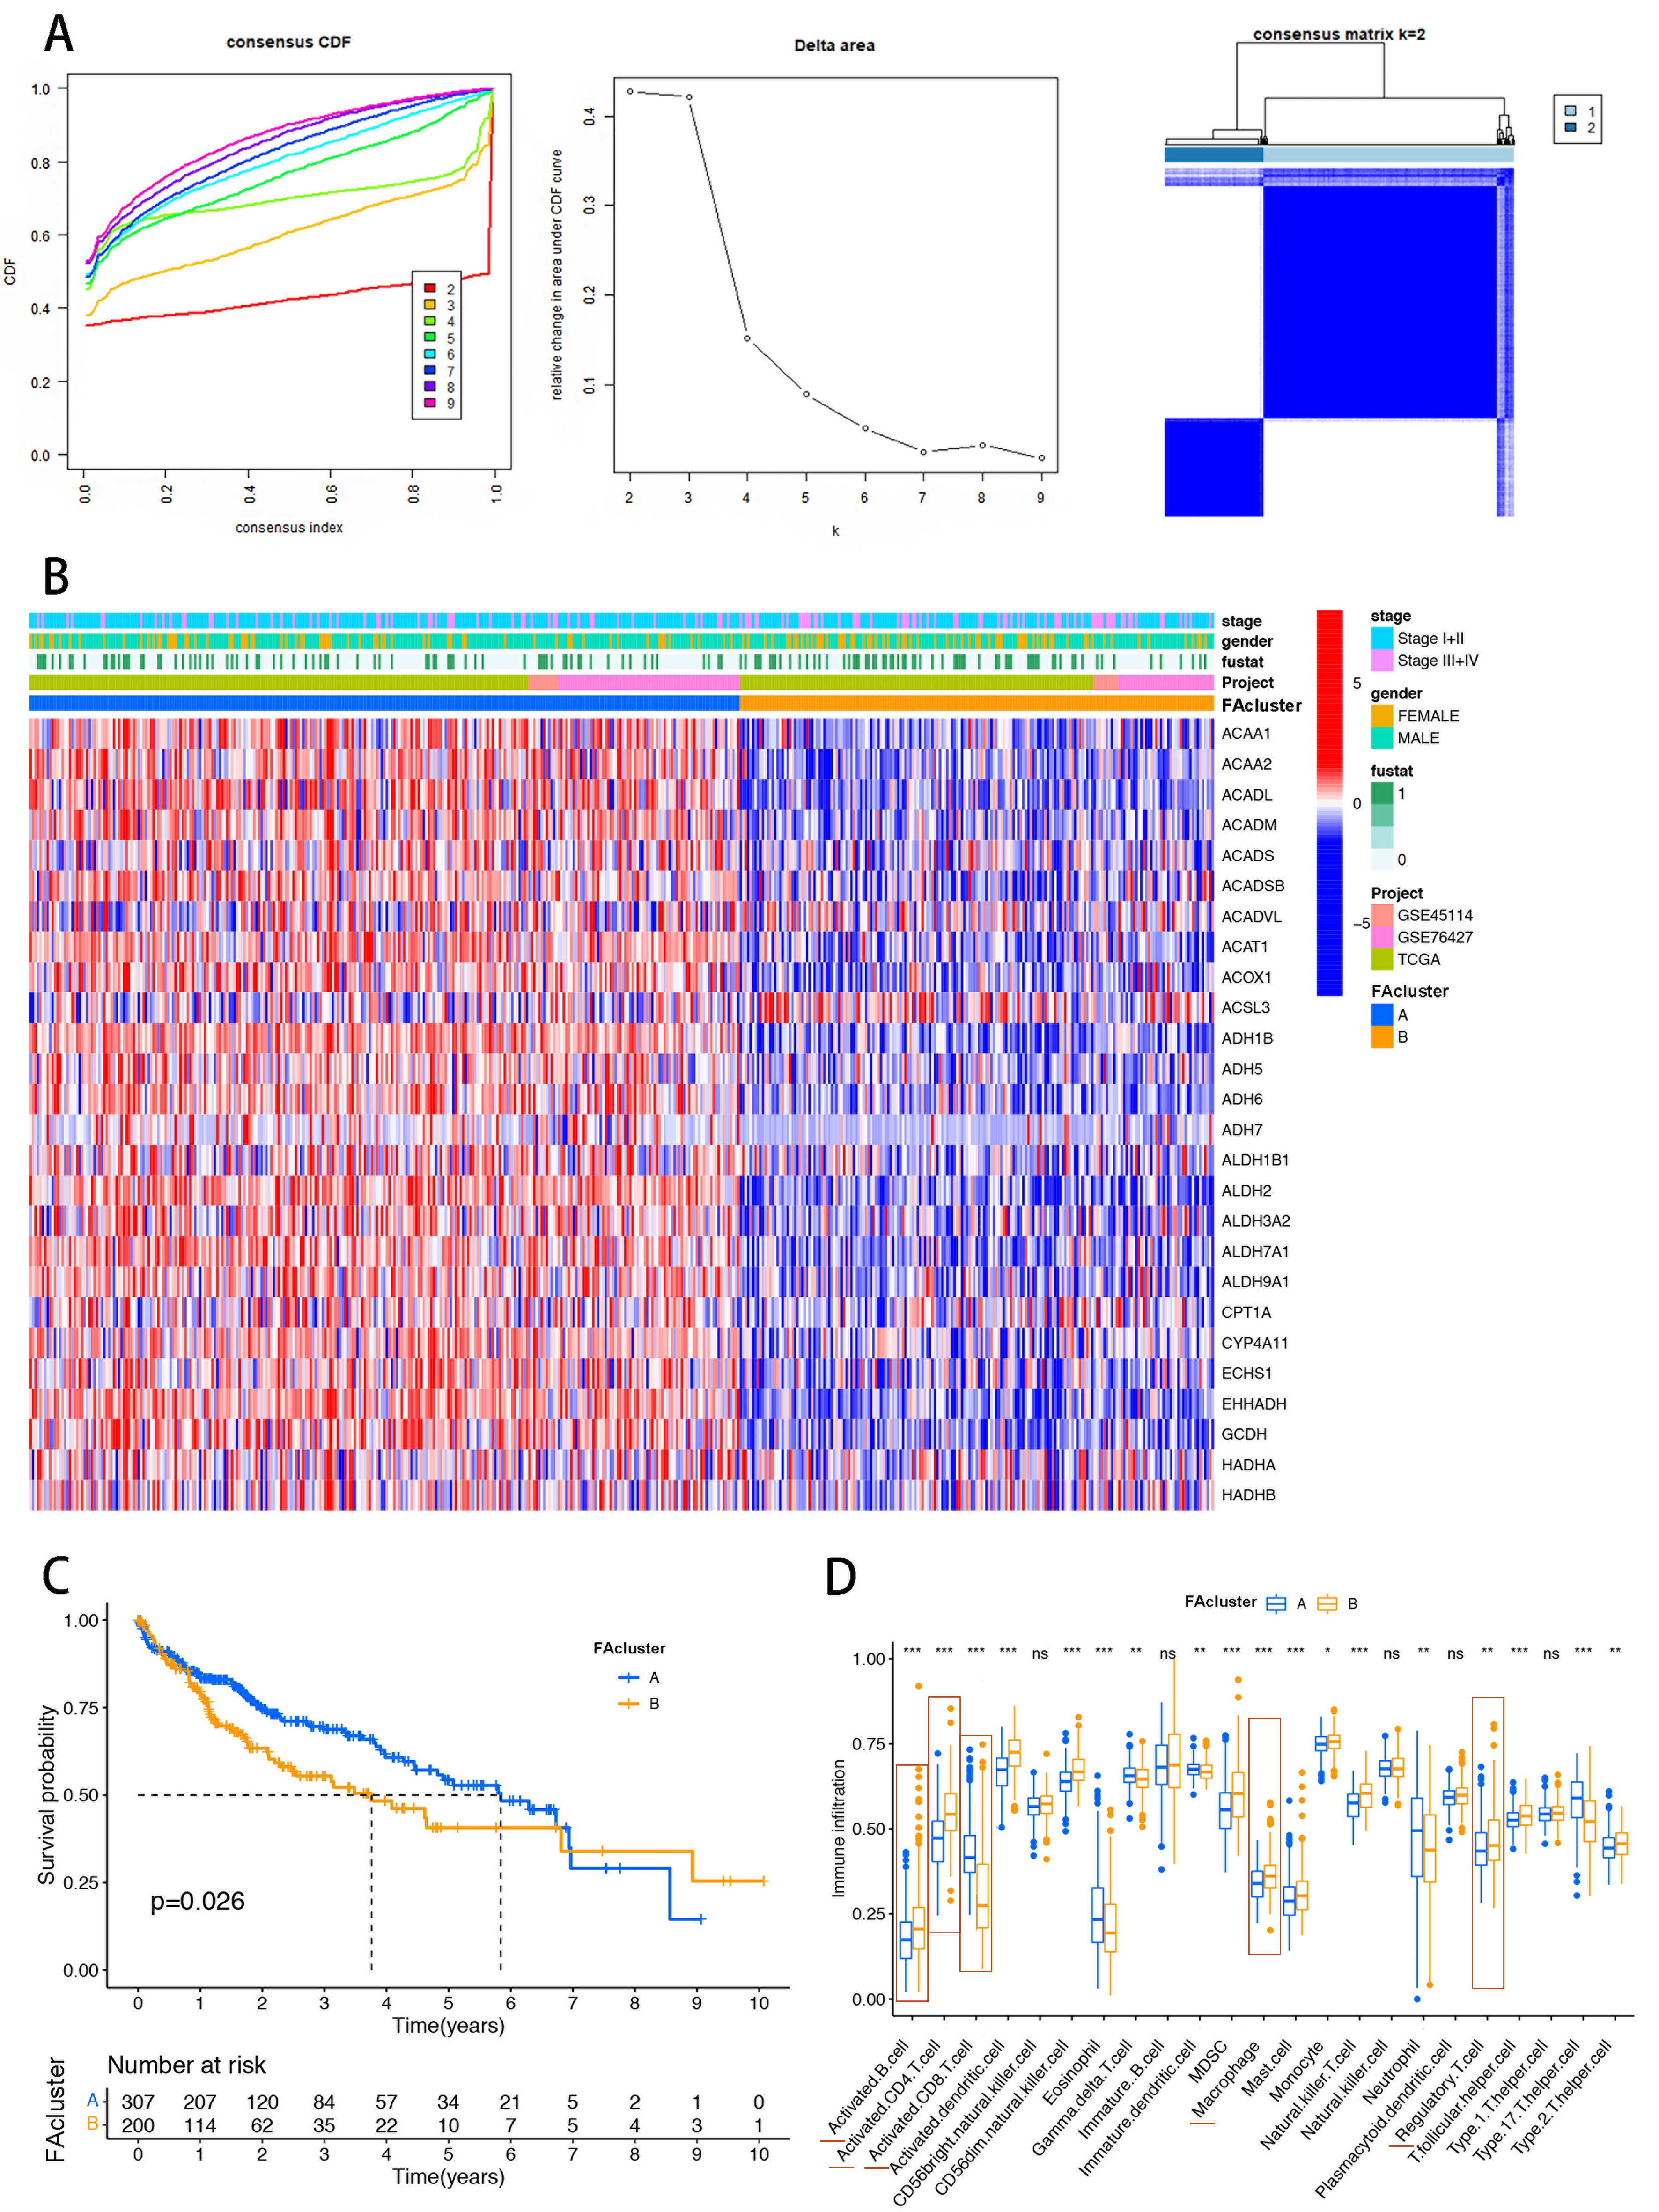
Figure 2. Construction of FA metabolism-related clustering in the HCC cohort. (A) CDF analysis used to select k = 2 for classifying HCC patients; (B) Heatmap showing distinct expression distributions of FA regulatory genes between the two clusters; (C) Kaplan-Meier analysis indicating poorer prognosis in cluster B; (D) CIBERSORT analysis of immune cell infiltration in HCC samples, showing higher recruitment of immunosuppressive cells (CD4+ T cells, MDSCs, Tregs) in cluster B. The red horizontal line marks significantly different immune cells. Statistical significance was assessed using the Wilcoxon rank-sum test. *P < 0.05; **P < 0.01; ***P < 0.001. FA: Fatty acid; HCC: hepatocellular carcinoma; CDF: cumulative distribution function; CIBERSORT: Cell-type Identification By Estimating Relative Subsets Of RNA Transcripts; CD4+ T cells: cluster of differentiation 4-positive T cells; MDSCs: myeloid-derived suppressor cells; Tregs: regulatory T cells; ns: not significant.
Establishment of an FA correlated scoring system in HCC patients
To further quantify the effect of FA metabolism on the immune microenvironment and clinical characteristics of HCC, we proposed a scoring system based on FA-related DEGs in this study, termed the FA_score. Then we carried out the validation of the FA_score throughout the clinical spectrum in the HCC cohort. As Figure 3A showed, the patients who had died at the end of the study presented higher FA_scores than those who were still alive. In addition, the FA_score involved in the high American Joint Committee on Cancer (AJCC) stage group (Stage III+IV) was increased as compared to the low-stage group (Stage I+II). However, there was no significant difference observed in FA_scores between genders. Besides, the results of Kaplan-Meier analysis demonstrated that FA_score was negatively correlated to the OS of HCC patients (Figure 3B and Supplementary Figure 4, P < 0.001).
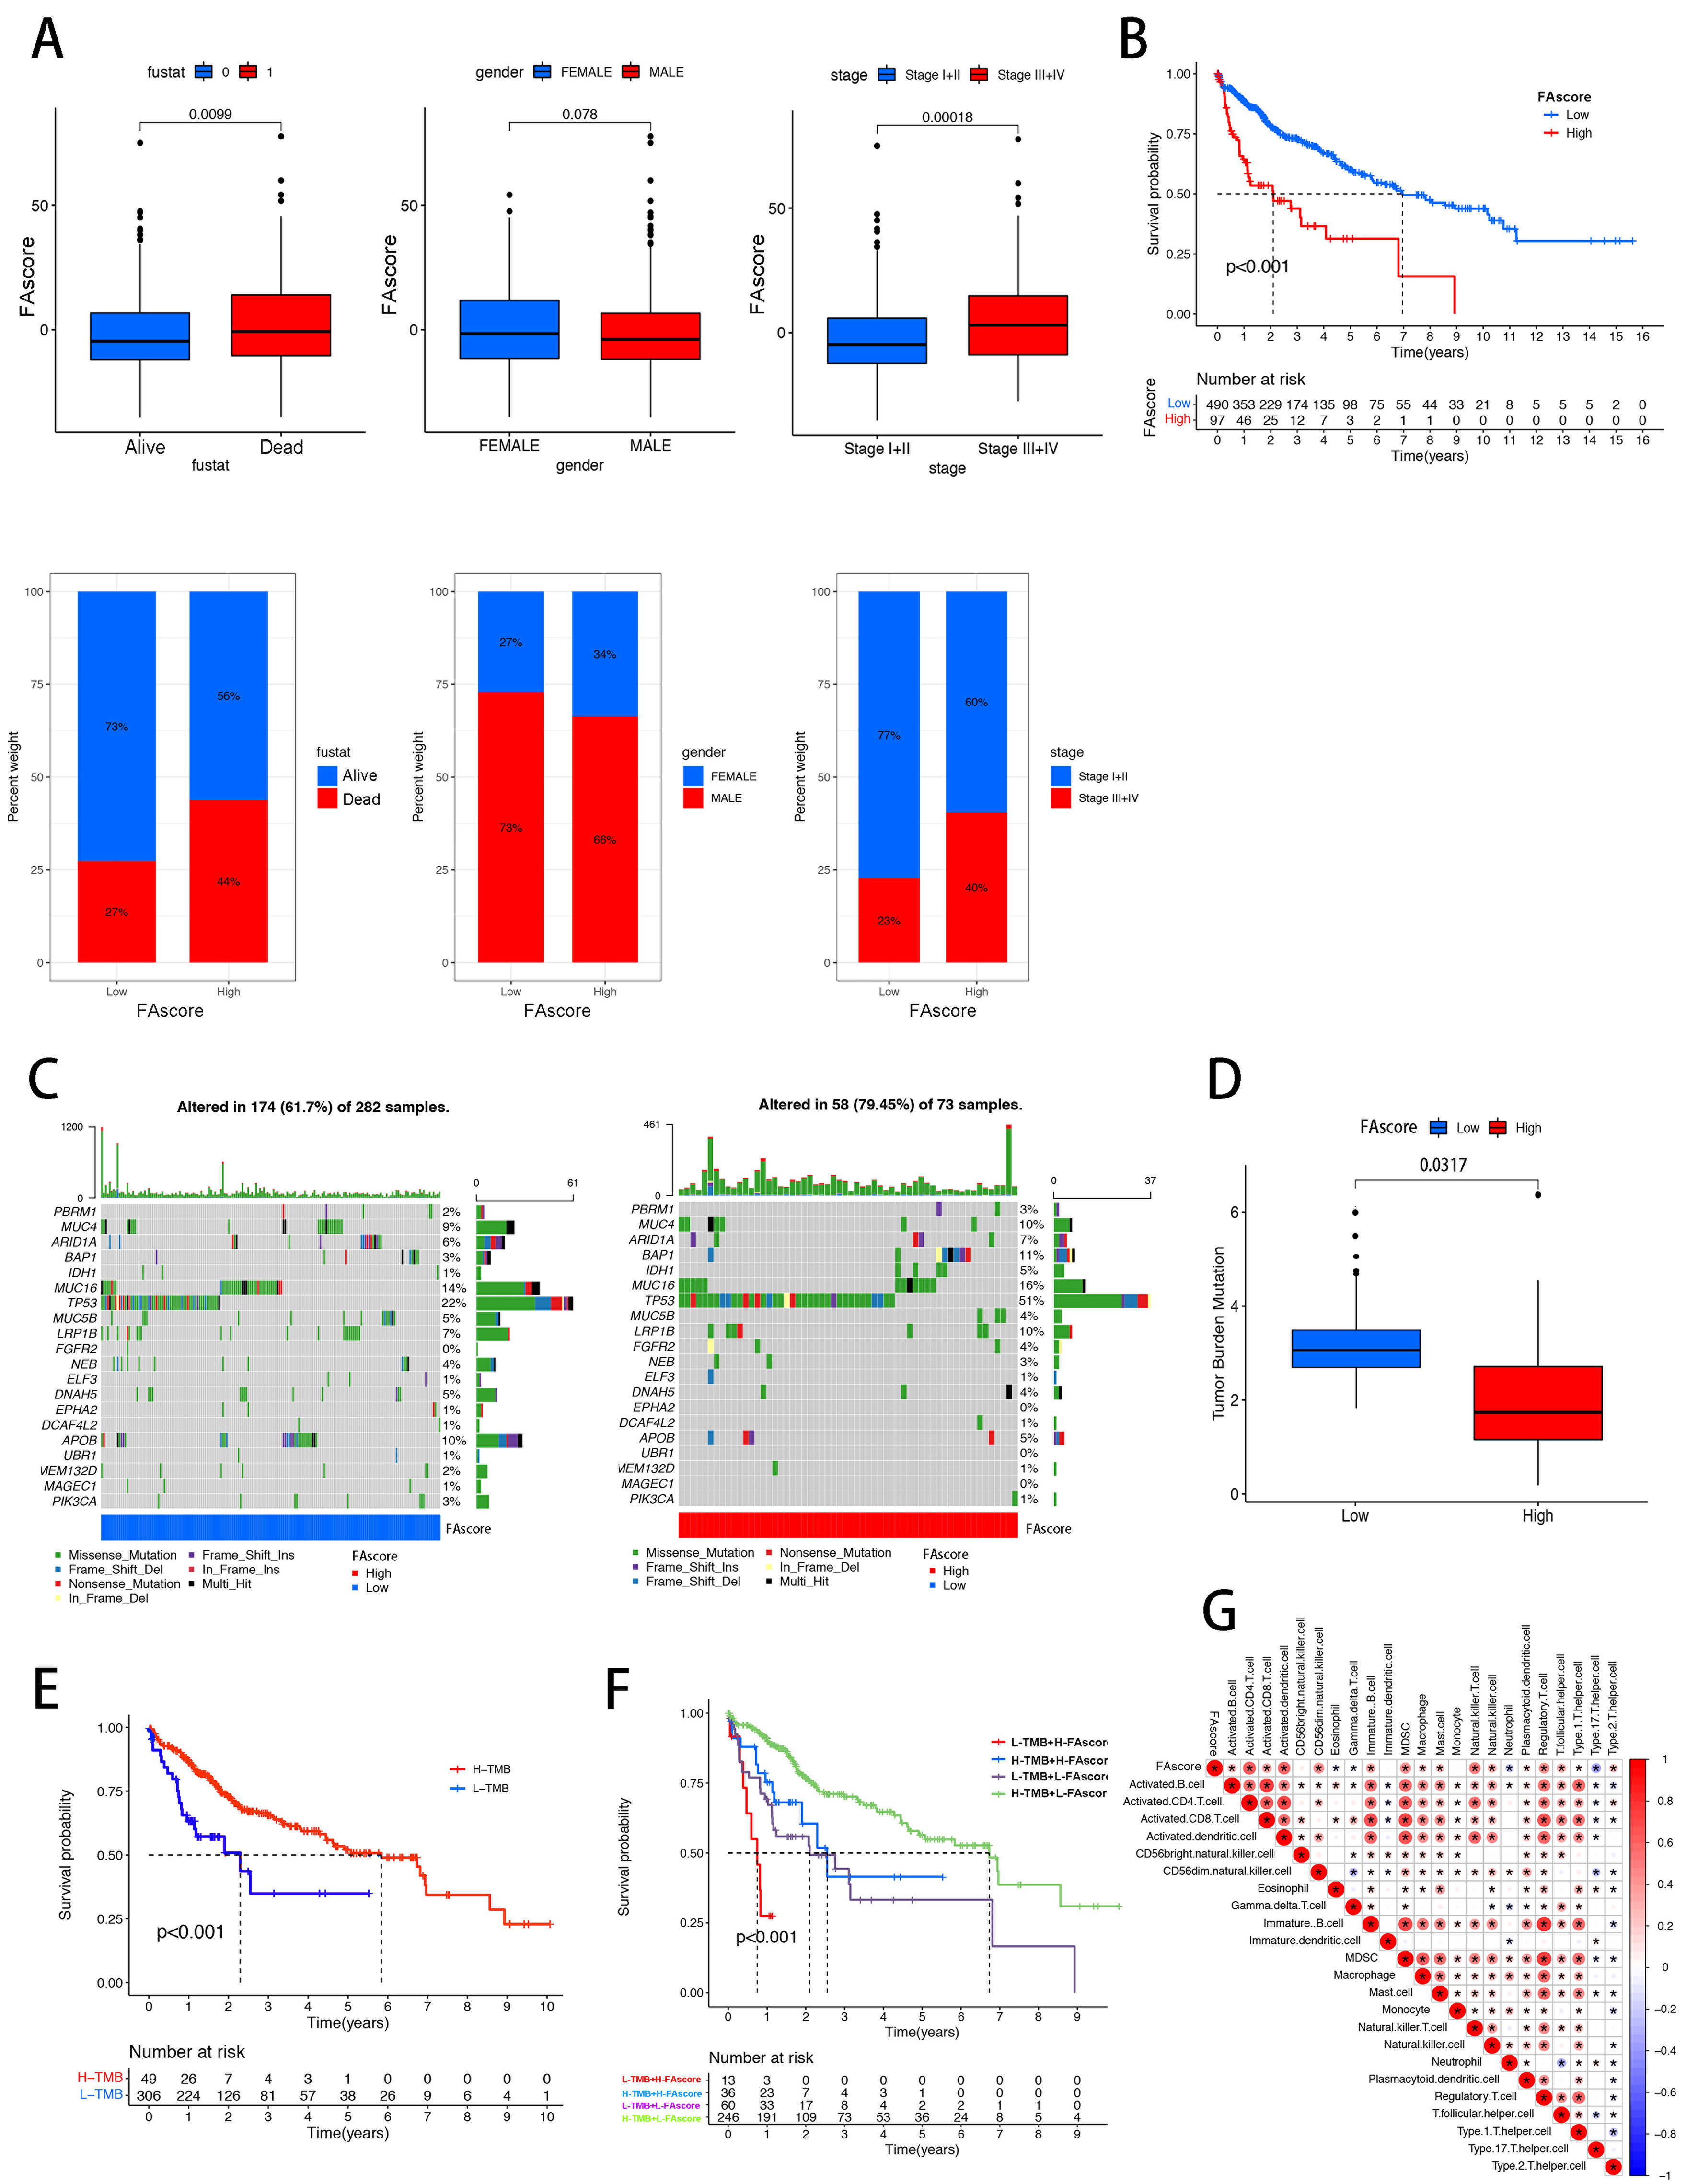
Figure 3. Correlations between clinical features and FA_score in HCC patients. FA-associated DEGs were used to establish an FA scoring system. (A) FA_score was higher in patients with advanced AJCC stage (Stage III+IV) compared with early stage (Stage I+II); (B) Patients with high FA_score had shorter OS than those with low FA_score; (C) High-frequency mutated genes in low and high FA_score groups, with TP53 and MUC16 ranking highest in both groups; (D) TMB was higher in the low FA_score group compared with the high FA_score group; (E and F) Patients stratified into four groups based on TMB and FA_score; the H-TMB L-FA_score cohort showed prolonged OS compared with the L-TMB H-FA_score cohort; (G) Immune cell infiltration patterns validated between low and high FA_score groups. FA: Fatty acid; FA_score: fatty acid-related score; HCC: hepatocellular carcinoma; DEGs: differentially expressed genes; AJCC: American Joint Committee on Cancer; OS: overall survival; TMB: tumor mutation burden; H: high; L: low.
Tumor mutational burden (TMB) holds promise as a predictive biomarker and may pave the way for the integration of immuno-oncology into the era of precision medicine. Through the integrative analysis between the TMB and FA_scores, the landscape of FA_score-related classification within the most frequent genomic alteration was displayed. It was noted that TP53 and Mucin 16 (MUC16) ranked the top two among these mutated genes, both in the low/high FA_score group [Figure 3C]. Furthermore, we found that the TMB level was reduced, followed by the increase of FA_score in HCC samples (Figure 3D, P = 0.0317). In accordance with TMB level and FA_score, we sorted the HCC patients into four groups, and our findings identified that the H-TMB L-FA_score cohort exhibited a markedly prolonged OS compared with the L-TMB H-FA_score cohort (Figure 3E and F, P < 0.001). We then assessed whether FA_score could impact the immune cell infiltration within the TME of HCC. As illustrated in Figure 3G, FA_score could predict the recruitment of CD56dim natural killer cells, activated CD4+ T cells, dendritic cells, MDSCs, and Tregs. Thus, FA_score could be used to predict the presence of immunosuppressive cells within the HCC TME.
Although immunotherapy has been shown to be effective in various malignancies, accumulating evidence indicates that its efficacy in HCC remains limited. Based on the results described above, we suspect that aberrant FA metabolism could potentially create a suppressive landscape for HCC immunotherapy. Thus, immunophenoscore (IPS) was calculated in each case. We investigated the underlying mechanisms of the predictive signature using the Cancer Immunome Atlas (TCIA) and mutational analysis. Our analysis revealed that in both negative for both cytotoxic T-lymphocyte-associated protein 4 (CTLA4-)/programmed cell death protein 1 (PD-1-) and CTLA4+/PD-1- HCC specimens, the IPS was significantly elevated in the low FA_score group compared to the high FA_score group [Figure 4A]. Tumor cells evade immune clearance by overexpressing anti-phagocytic “don’t eat me” signals, including CD47, programmed cell death protein 1 (PD-L1), and CD24. Importantly, expression levels of these immune checkpoint molecules showed a positive correlation with FA_score in tumor tissues [Supplementary Figure 5]. Besides, we found out that microsatellite instability low (MSI-L) cases had a higher FA_score than microsatellite stability (MSS) cases (Figure 4B and C, P = 0.00098). Totally, all these findings demonstrated that FA metabolism reprogramming might function as a suppressive factor in mediating the immunotherapy efficiency of HCC patients.
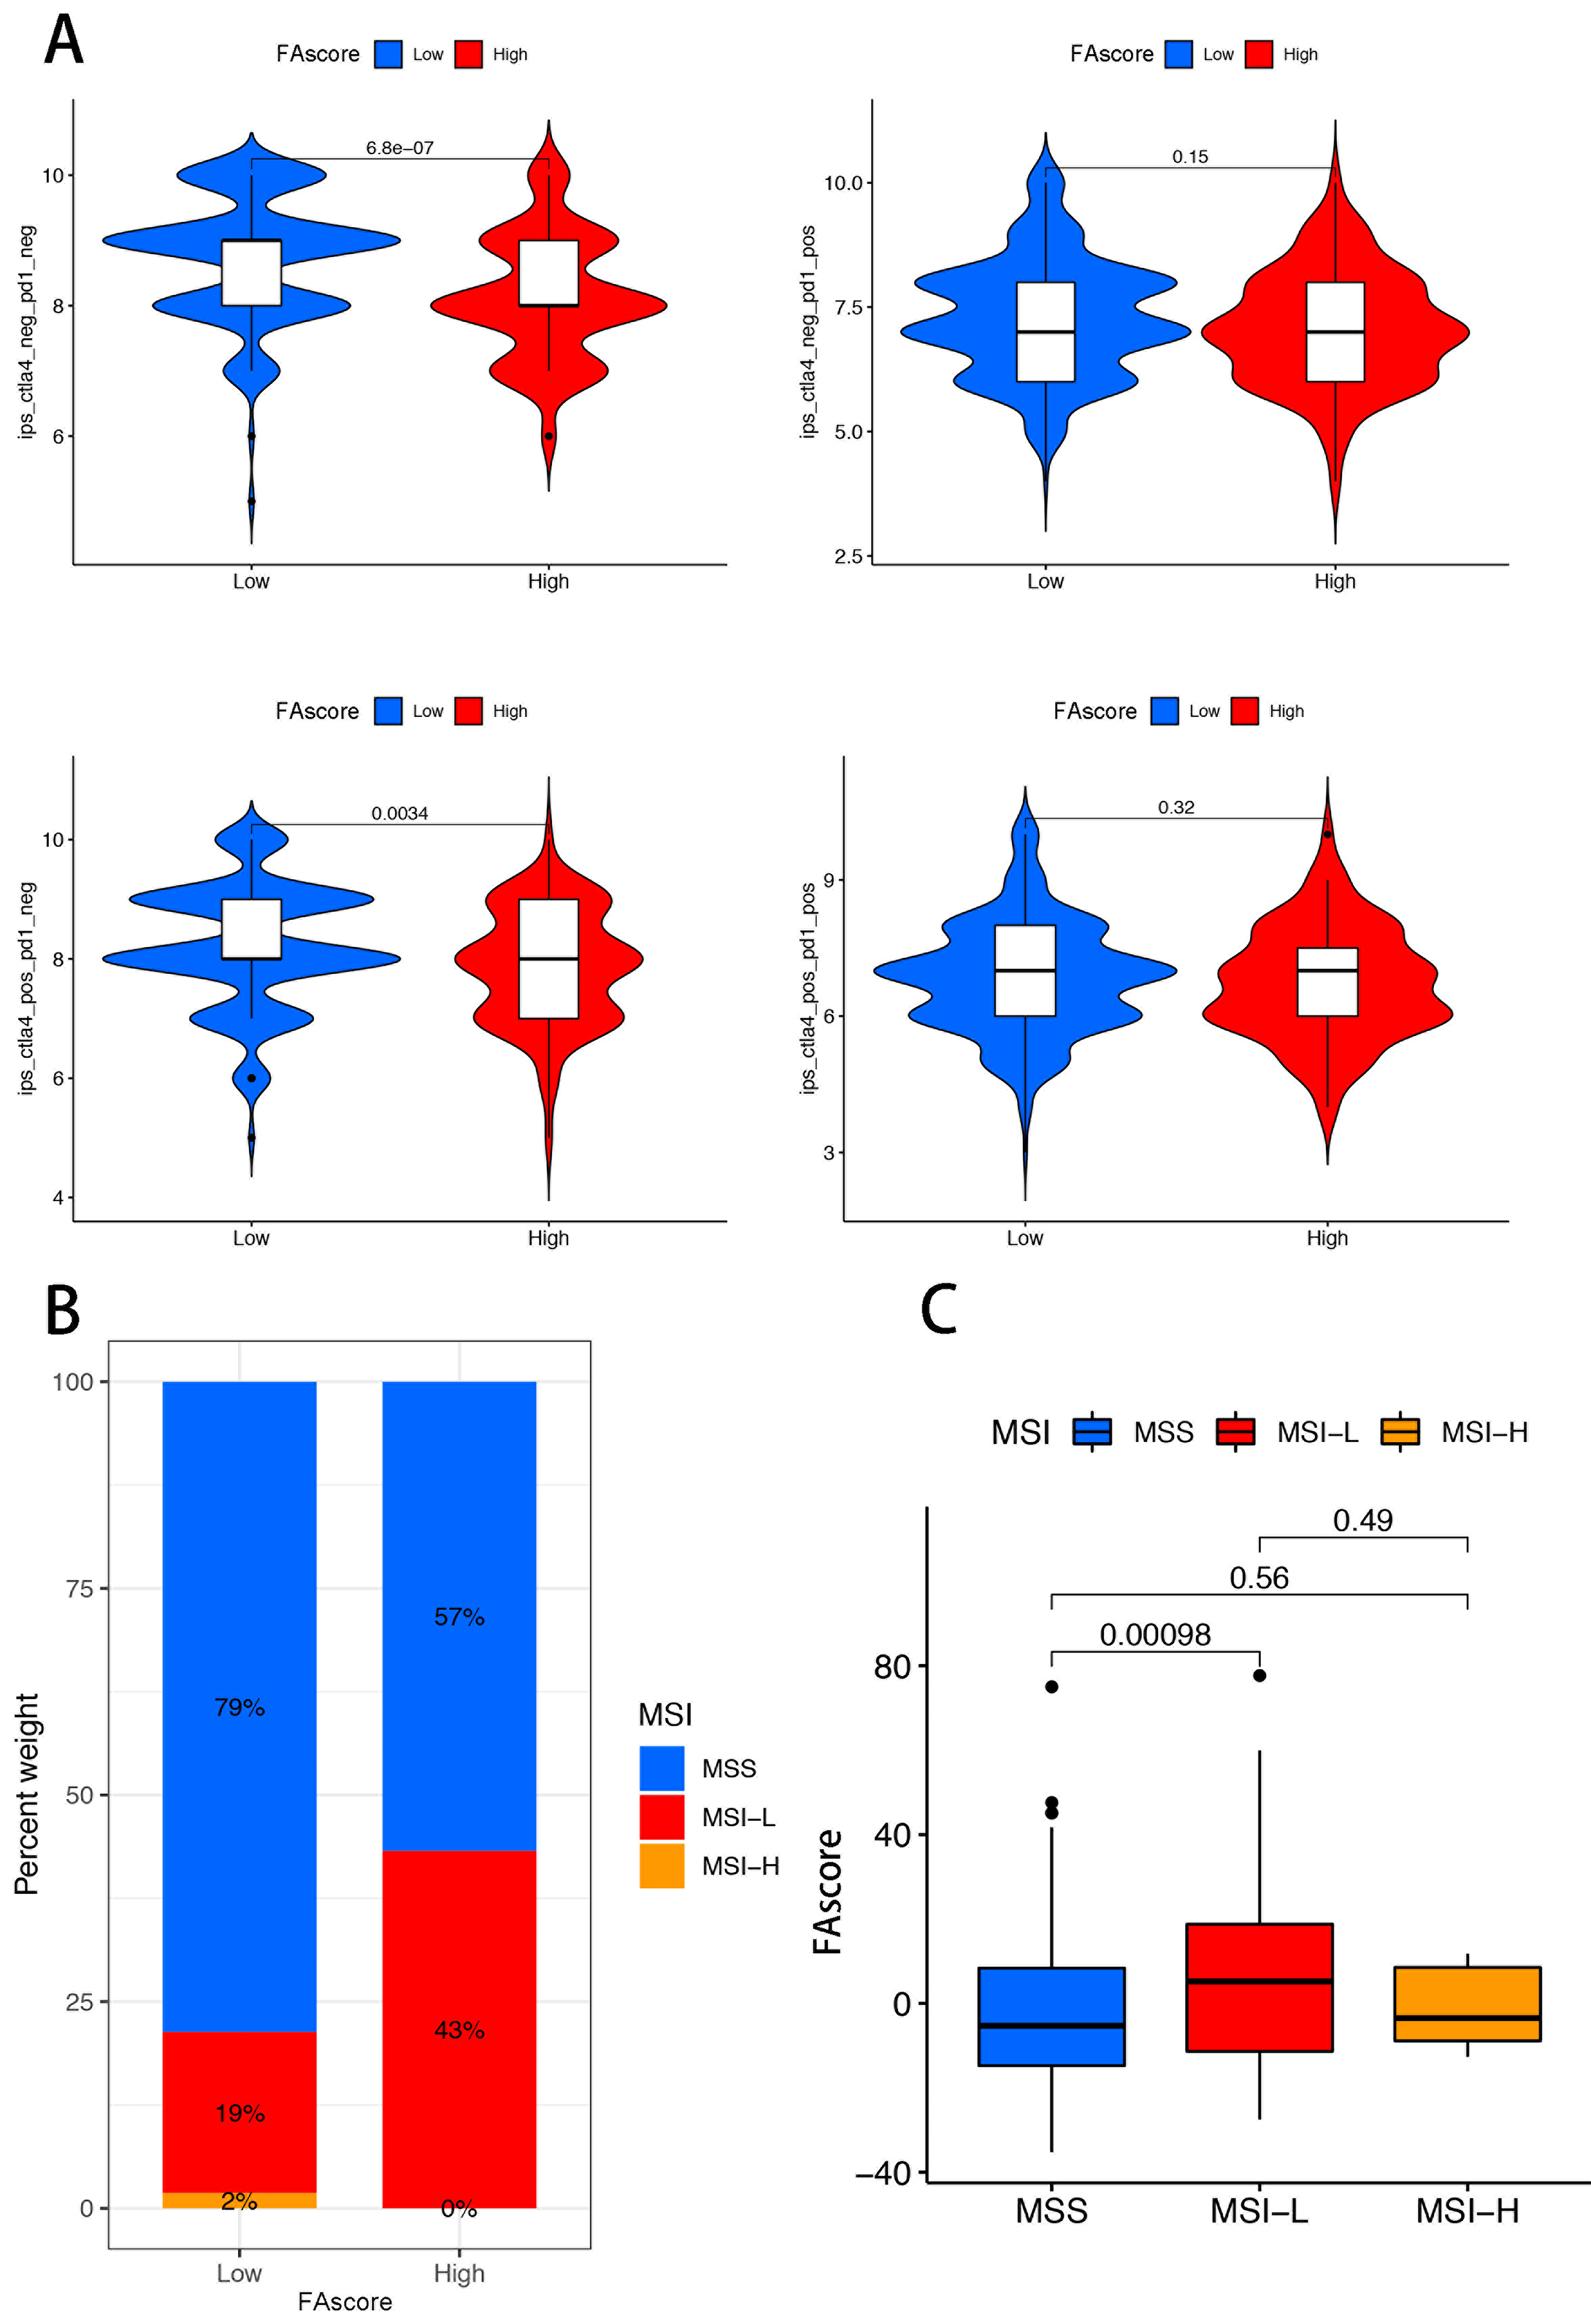
Figure 4. Association of FA_score with IPS and MSI in HCC. (A) Higher IPS levels in the low FA_score group compared with the high FA_score group in CTLA4_neg_PD-1_neg and CTLA4_pos_PD-1_neg HCC cases; (B and C) FA_score was higher in the MSI-L cohort compared with the MSS group. FA_score: Fatty acid-related score; IPS: immunophenoscore; MSI: microsatellite instability; MSS: microsatellite stability; HCC: hepatocellular carcinoma; CTLA4: cytotoxic T-lymphocyte-associated protein 4; PD-1: programmed cell death protein 1.
Construction of an immune risk model for HCC patients
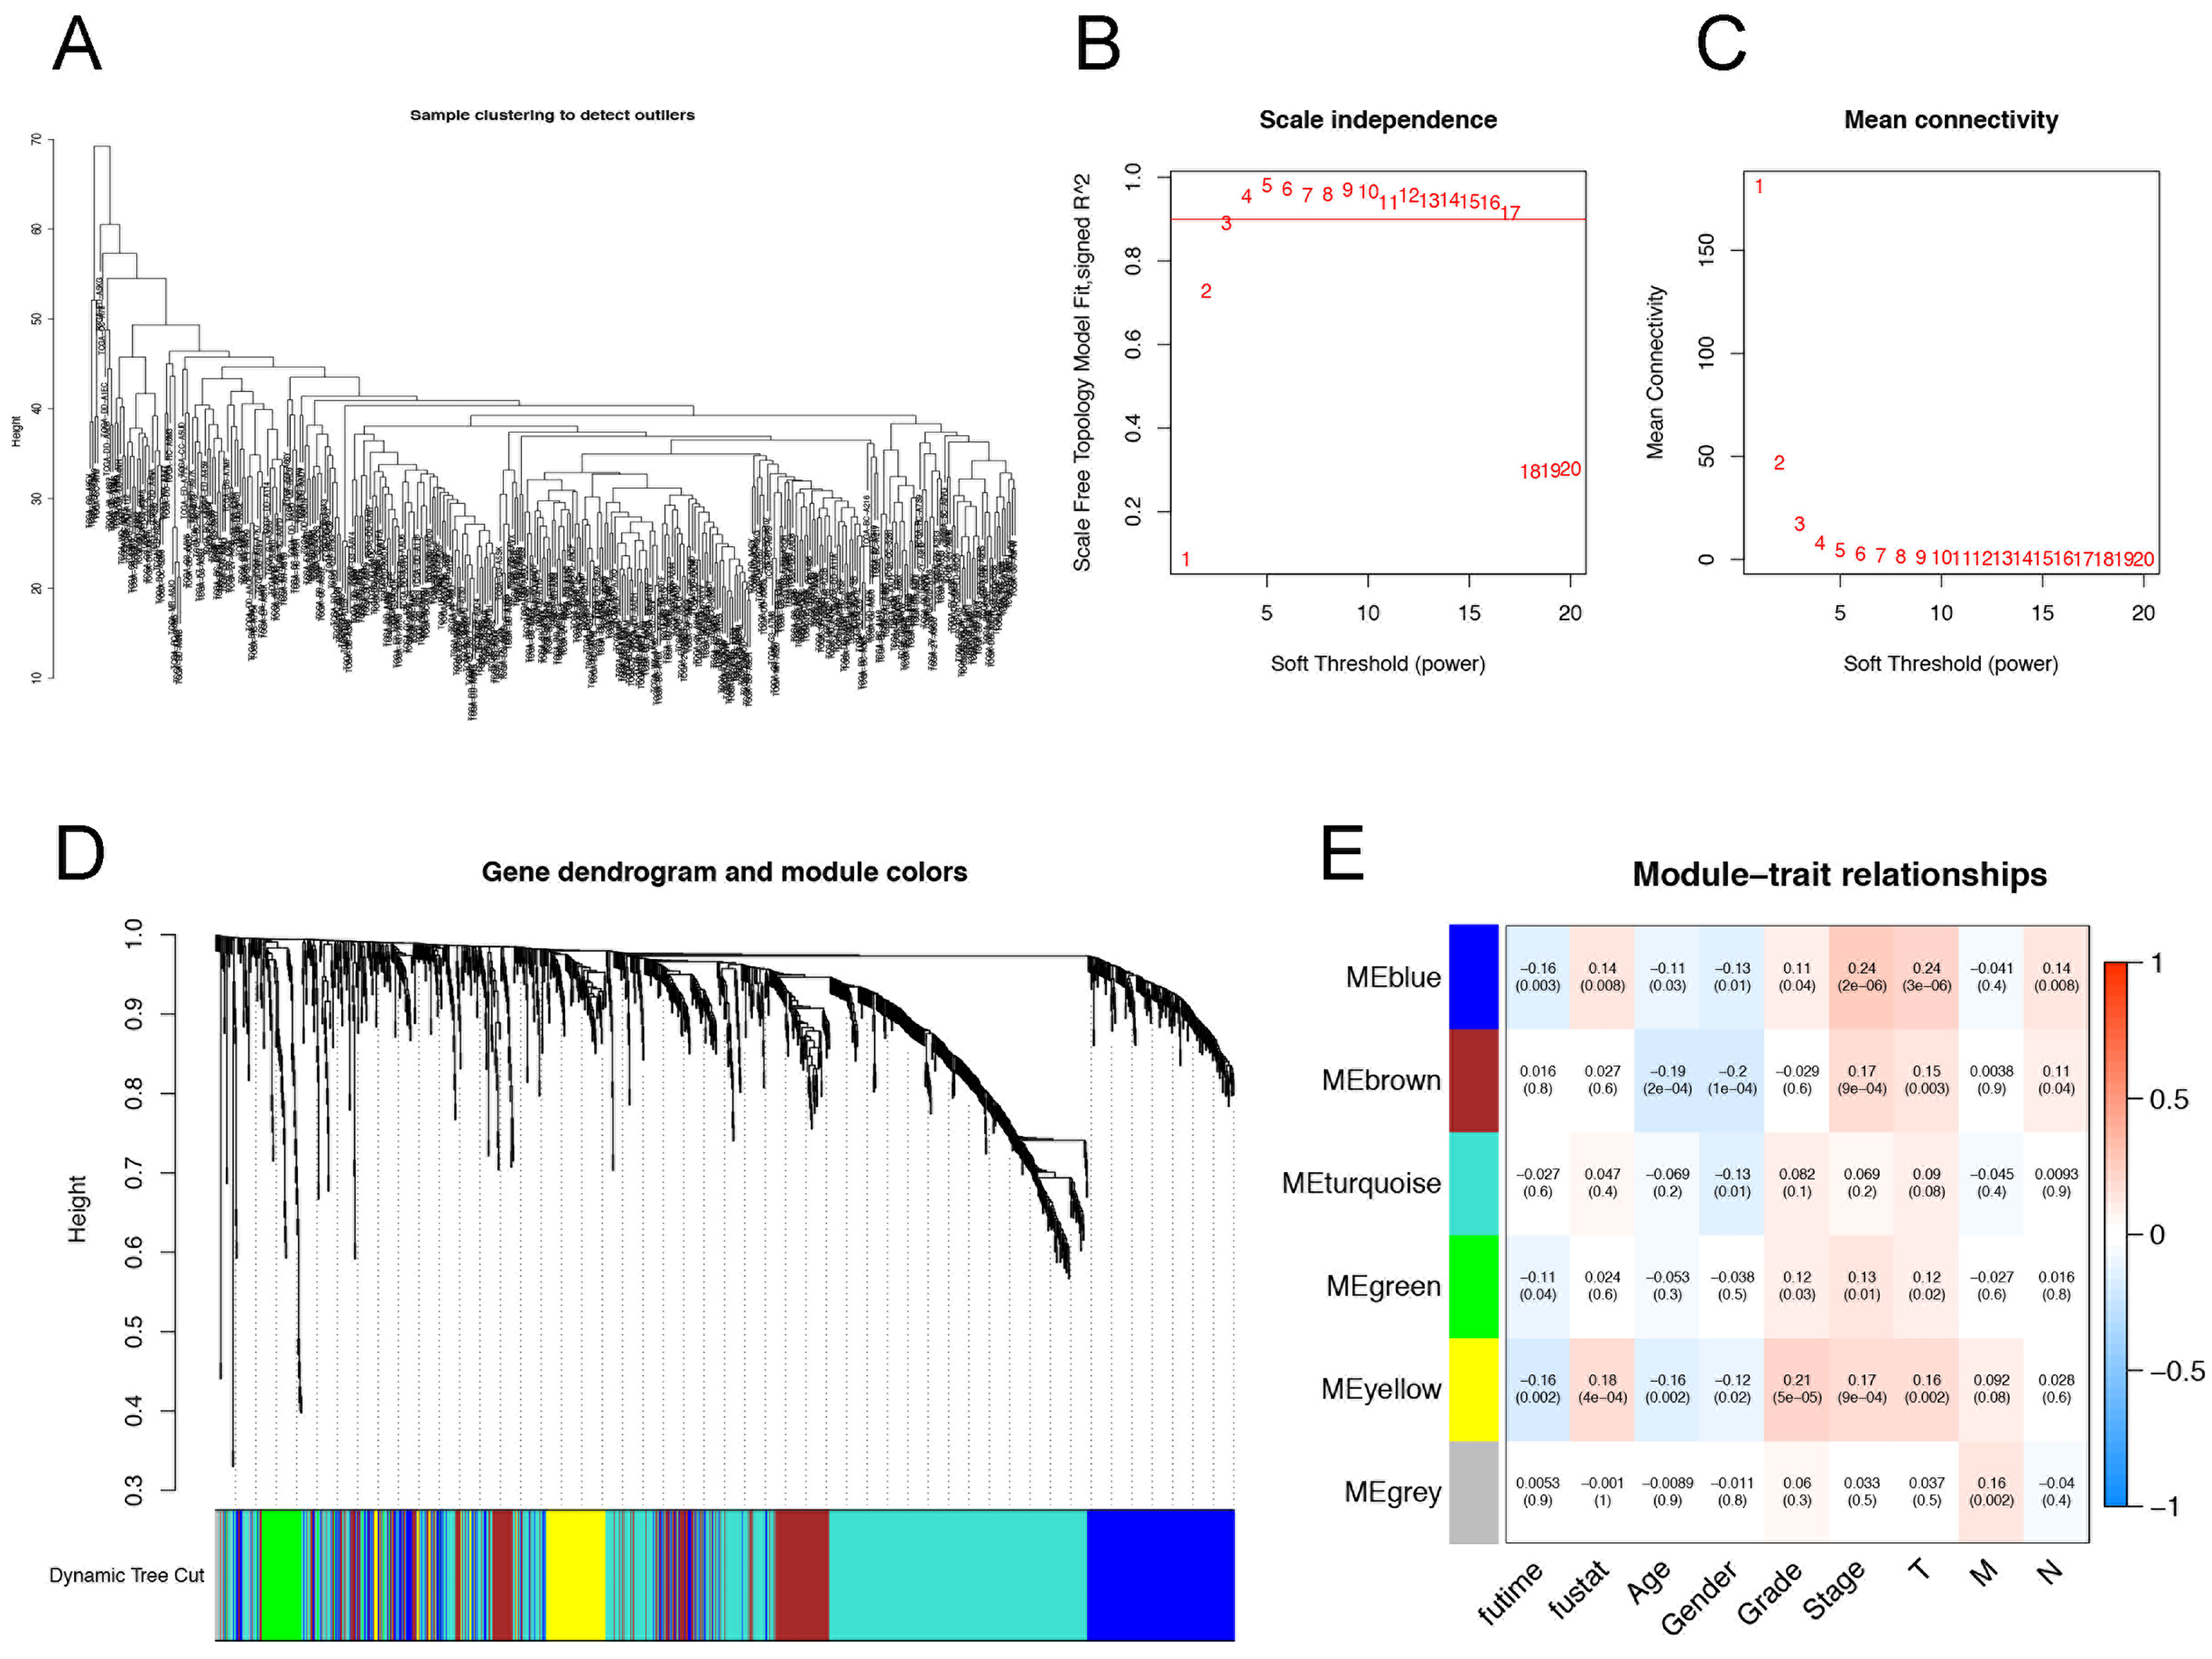
Figure 5. Identification of immune gene co-expression modules in HCC. (A) Sample clustering within the HCC cohort; (B) Scale-free fit index across different soft-thresholding powers (β); (C) Mean connectivity at various soft-thresholding powers; (D) Dendrogram of DEGs based on a dissimilarity measure (1-TOM); (E) Analysis of interactions within each module in HCC samples. HCC: Hepatocellular carcinoma; DEGs: differentially expressed genes; TOM: topological overlap matrix.
Combined with the clinical data from TCGA, we tried to screen out the prognosis-related immune genes in the HCC cohort. All enrolled HCC patients from TCGA were randomly divided into a training group (n = 262) and a validation group (n = 109). Using the proportional hazards model, 13 variables were identified as correlated with survival [Figure 6A and B]. These include five long non-coding RNAs: MR210HG, AC015908.3, AL031985.3, MYG1-AS1, ZFPM2-AS1, and eight protein-coding genes:
· PSMC6 (Proteasome 26S Subunit, ATPase 6)
· PSMD6 (Proteasome 26S Subunit, Non-ATPase 6)
· PSMD14 (Proteasome 26S Subunit, Non-ATPase 14)
· MAPT (Microtubule-Associated Protein Tau)
· MTNR1A (Melatonin Receptor 1A)
· NR6A1 (Nuclear Receptor Subfamily 6 Group A Member 1)
· DEFB123 (Defensin Beta 123)
· PTH (Parathyroid Hormone).
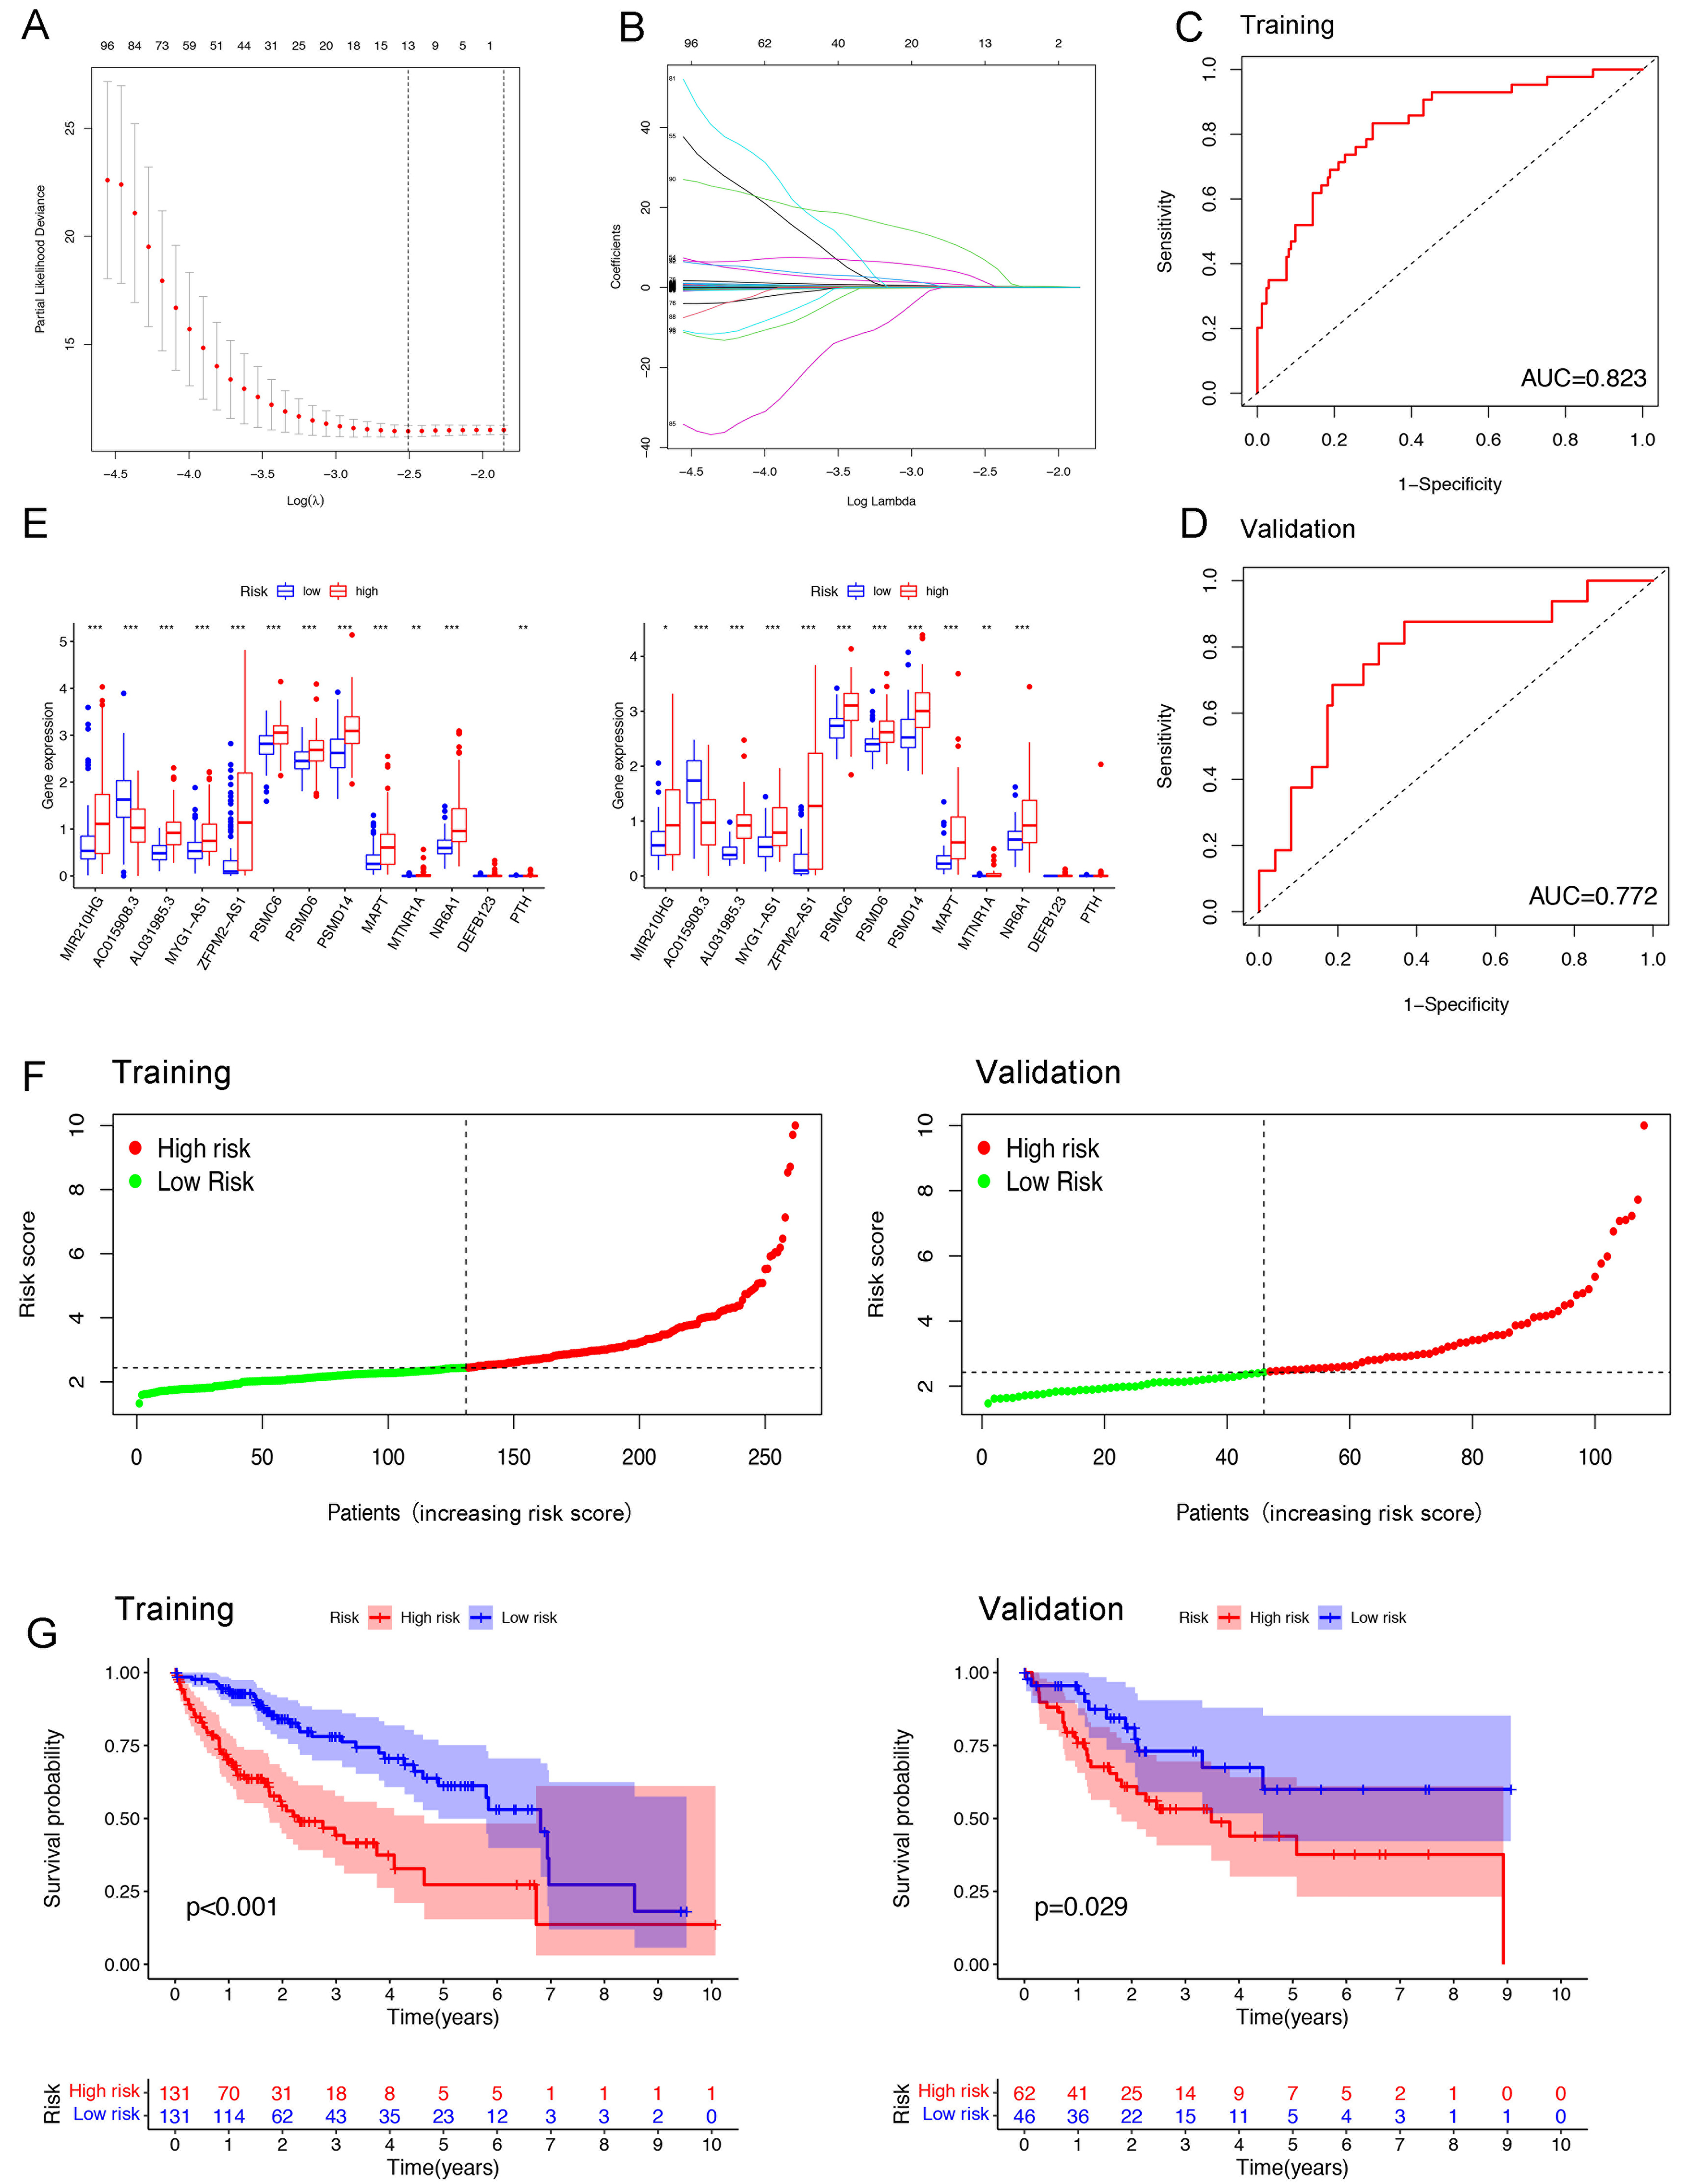
Figure 6. Establishment of an immune-related risk model in HCC patients. (A and B) LASSO analysis identified 13 variables (MR210HG, AC015908.3, AL031985.3, MYG1-AS1, ZFPM2-AS1, PSMC6, PSMD6, PSMD14, MAPT, MTNR1A, NR6A1, DEFB123, and PTH) associated with HCC patient survival; (C and D) AUROCs evaluating the discrimination power of the risk model in the training and validation phases; (E) Expression levels of the 13 variables in low- and high-risk groups; (F) Immune risk scores of HCC patients in the training and validation phases; (G) Kaplan-Meier analysis showing better prognosis for the low-risk group compared with the high-risk group. Statistical significance assessed using the Wilcoxon rank-sum test. *P < 0.05; **P < 0.01; ***P < 0.001. HCC: Hepatocellular carcinoma; LASSO: least absolute shrinkage and selection operator; AUROC: area under the receiver operating characteristic curve.
Subsequently, an immune risk model was established to validate the association between survival and 13 immune genes. The performance of this model was assessed using ROC curves. The areas under the ROC curve (AUROCs) for OS probability in both the training and validation groups were 0.823 and 0.772, respectively [Figure 6C and D]. Differential expression of these 13 variables was evaluated in both the high-risk and low-risk groups [Figure 6E and Supplementary Figure 6A]. Figure 6F shows the risk scores for each HCC patient in both the training and validation phases. As shown in Figure 6G and Supplementary Figure 6B, patients in the high-risk group exhibited poorer prognosis compared to those in the low-risk group. Additionally, CIBERSORT analysis was performed to assess the infiltration levels of immune cell types within this risk model. The results showed that, compared to the low-risk group, the high-risk group had significantly higher recruitment of activated CD4+ T cells, activated dendritic cells, and Tregs [Supplementary Figure 6C and D]. In conclusion, HCC patients with a high immune risk score had a worse prognosis, and the TMB in the high-risk cohort was notably enriched in immunosuppressive cells.
A complex clustering system based on the FA_score and the immune risk score
The recent studies have confirmed that FA metabolic reprogramming and suppressive TME construction are an indivisible whole to facilitate the pathogenesis of various malignancies[36-38]. Thus, we wanted to combine the FA_score and immune risk score to establish a novel complex clustering system that was specific for the HCC patients. Firstly, we defined cluster A and an immune risk_score high as a MI cluster 1. Similarly, the remaining three MI clusters were defined as follows: MI-2 (cluster B and immune risk_score high), MI-3 (cluster A and immune risk_score low), and MI-4 (cluster B and immune risk_score low).
In Figure 7A, we identified that the expressions of most FA metabolism regulators were separately distributed in all four clusters. Through the PCA visualization, we also confirmed that the HCC cases in each MI subtype were differentially classified [Figure 7B]. Interestingly, we found out that the MI cluster-2 showed the highest FA_score among these four MI clusters [Figure 7C]. Compared to the other three MI clusters, the upregulations of FA correlated DEGs were observed in MI cluster-2 [Figure 7D]. Meanwhile, using the Kaplan-Meier analysis, it was indicated that the MI cluster-2 showed the worst OS among these four MI clusters (Figure 7E, P = 0.004). Besides, we discovered that infiltration levels of activated CD4+ T cells, MDSCs, and Tregs were higher in MI cluster-2 than those of the other three clusters [Figure 7F]. Then, we investigated the expressions of CD4+ T cells, MDSCs, and Tregs biomarkers in different MI clusters (the gene lists of biomarkers were obtained from the GSEA website). Significant differences in the expression of these biomarkers were observed in MI cluster-2 [Supplementary Figure 7]. Consistently, we also investigated the DEGs between the MI-2 cluster and MI-1/3/4 clusters, and a total of 16 DEGs were explored. Utilizing the single-cell sequence of HCC tissues obtained from a public database (GSE146115), we discovered that thioredoxin reductase 1 (TXNRD1) and sequestosome 1 (SQSTM1, commonly known as p62) were highly expressed in naïve CD8+ T cells, and SQSTM1 was upregulated in CD8+ T cells. Thus, we suspected the infiltration levels of these three special immune cells (TXNRD1+ naïve CD8+ T cells, SQSTM1+ naïve CD8+ T cells, and SQSTM1+ CD8+ T cells) were influenced by the FA metabolism reprogramming in HCC [Supplementary Figure 8]. All these findings suggested that HCC patients in MI cluster-2 showed poor prognosis and limited response to immunotherapy, and this clustering system would be essential for us to eliminate the potential HCC patients who were not suitable for immunotherapy.
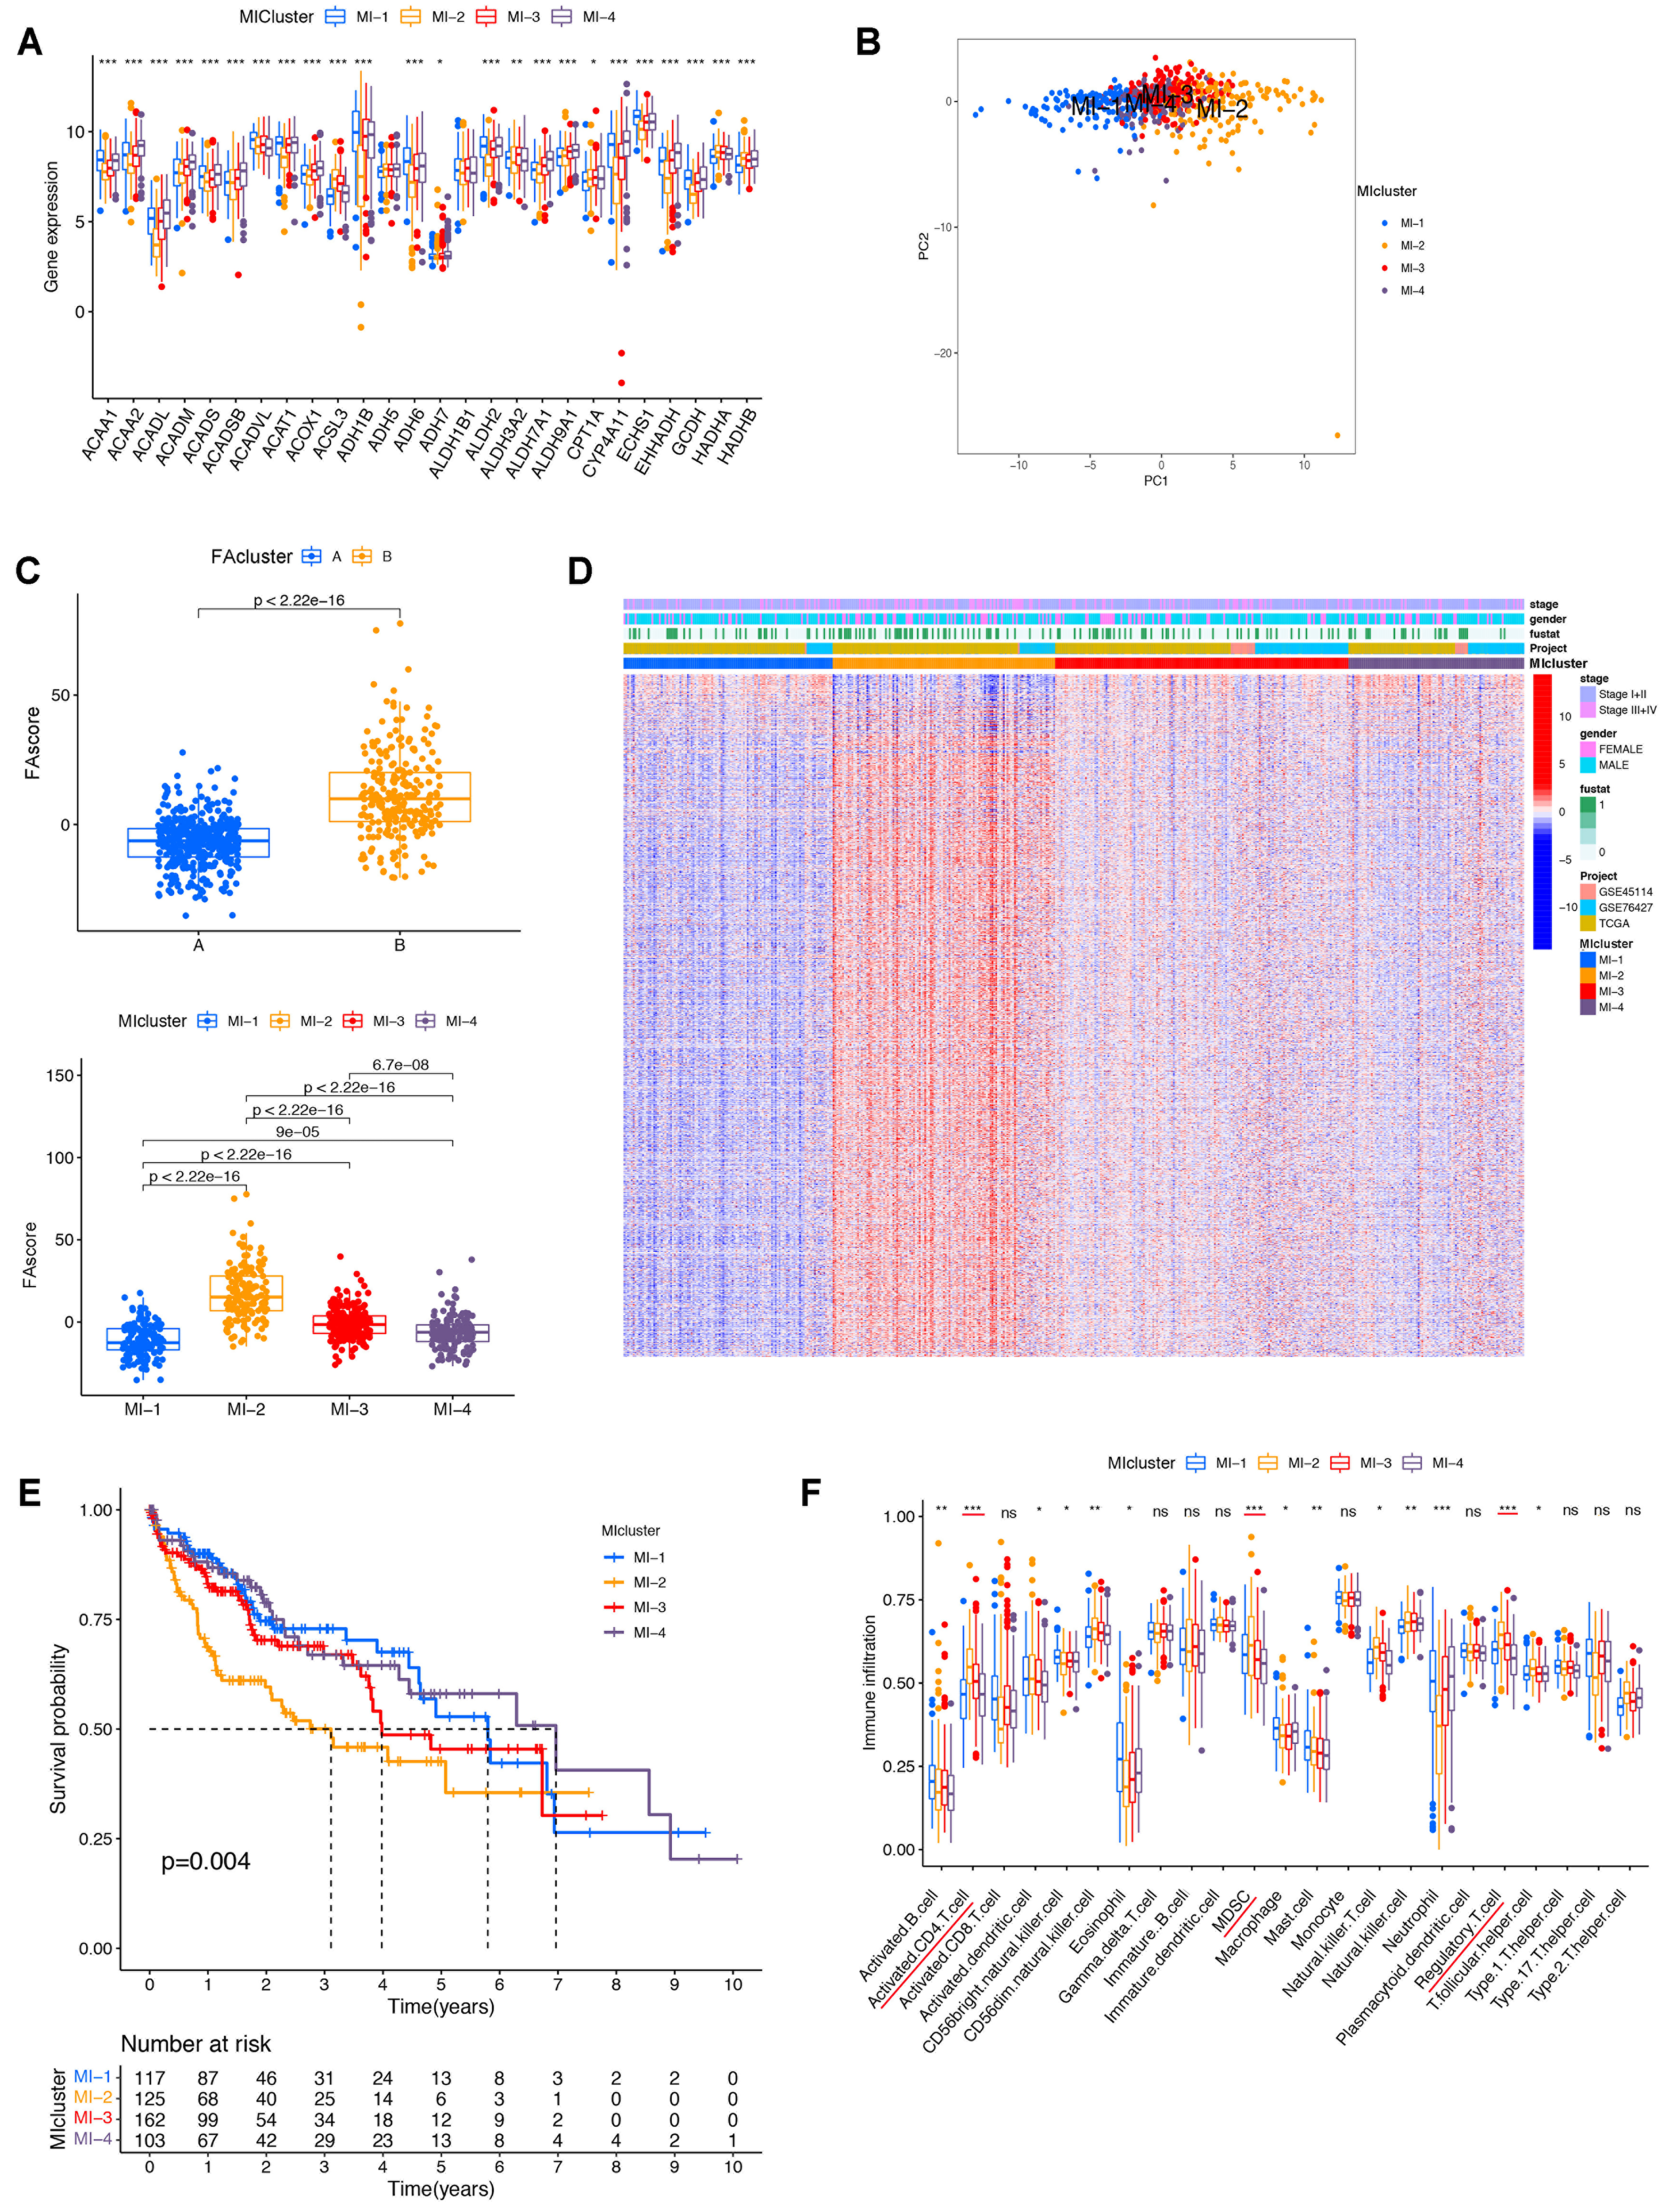
Figure 7. Complex clustering based on FA_score and immune risk score. (A) Expression of 42 FA metabolism regulators across different MI clusters; (B) PCA analysis showing separate distribution of HCC patients in MI clusters 1-4; (C) FA_score comparison: cluster B higher than cluster A (upper panel); MI cluster-2 higher than the other three MI clusters (lower panel); (D) Heatmap showing enrichment of FA-associated DEGs in MI cluster-2; (E) Kaplan-Meier analysis indicating MI cluster-2 had the longest overall survival among the four MI clusters; (F) Infiltration levels of activated CD4+ T cells, MDSCs, and Tregs were higher in MI cluster-2 compared with the other clusters. Statistical significance assessed using the Kruskal-Wallis test. *P < 0.05; **P < 0.01; ***P < 0.001. FA: Fatty acid; MI: mixed index; HCC: hepatocellular carcinoma; PCA: principal component analysis; DEGs: differentially expressed genes; CD4+ T cells: cluster of differentiation 4-positive T cells; MDSCs: myeloid-derived suppressor cells; Tregs: regulatory T cells; ns: not significant.
Establishment of an FA metabolism-associated nomogram for HCC patients
Subsequently, we tried to create an FA_score and MI-clusters-based prognostic model for HCC patients. All 507 enrolled patients in our study (both from TCGA and GEO databases) were randomly divided into a training group (n = 297) and a validation group (n = 210). Through the Least Absolute Shrinkage and Selection Operator (LASSO) regression model, four survival correlated factors were identified, including MI-clusters, FA_score, pathological grade, and TNM stage [Figure 8A and B]. Based on the multivariable Cox proportional hazards model, a prognostic nomogram was constructed to estimate 3- and 5-year OS in HCC patients [Figure 8C]. Using the ROC curves and C-index values, we further validate the discrimination power of this nomogram. As Figure 8D and E showed, the AUROCs of the 3-year survival and 5-year survival probabilities in the training were 0.837 and 0.821, respectively. As for the validation cohort, the AUROCs of the 3-year survival and 5-year survival probabilities were 0.824 and 0.787. The calibration curves of the nomogram showed good probability consistencies between the prediction and observation [Figure 8F and G].
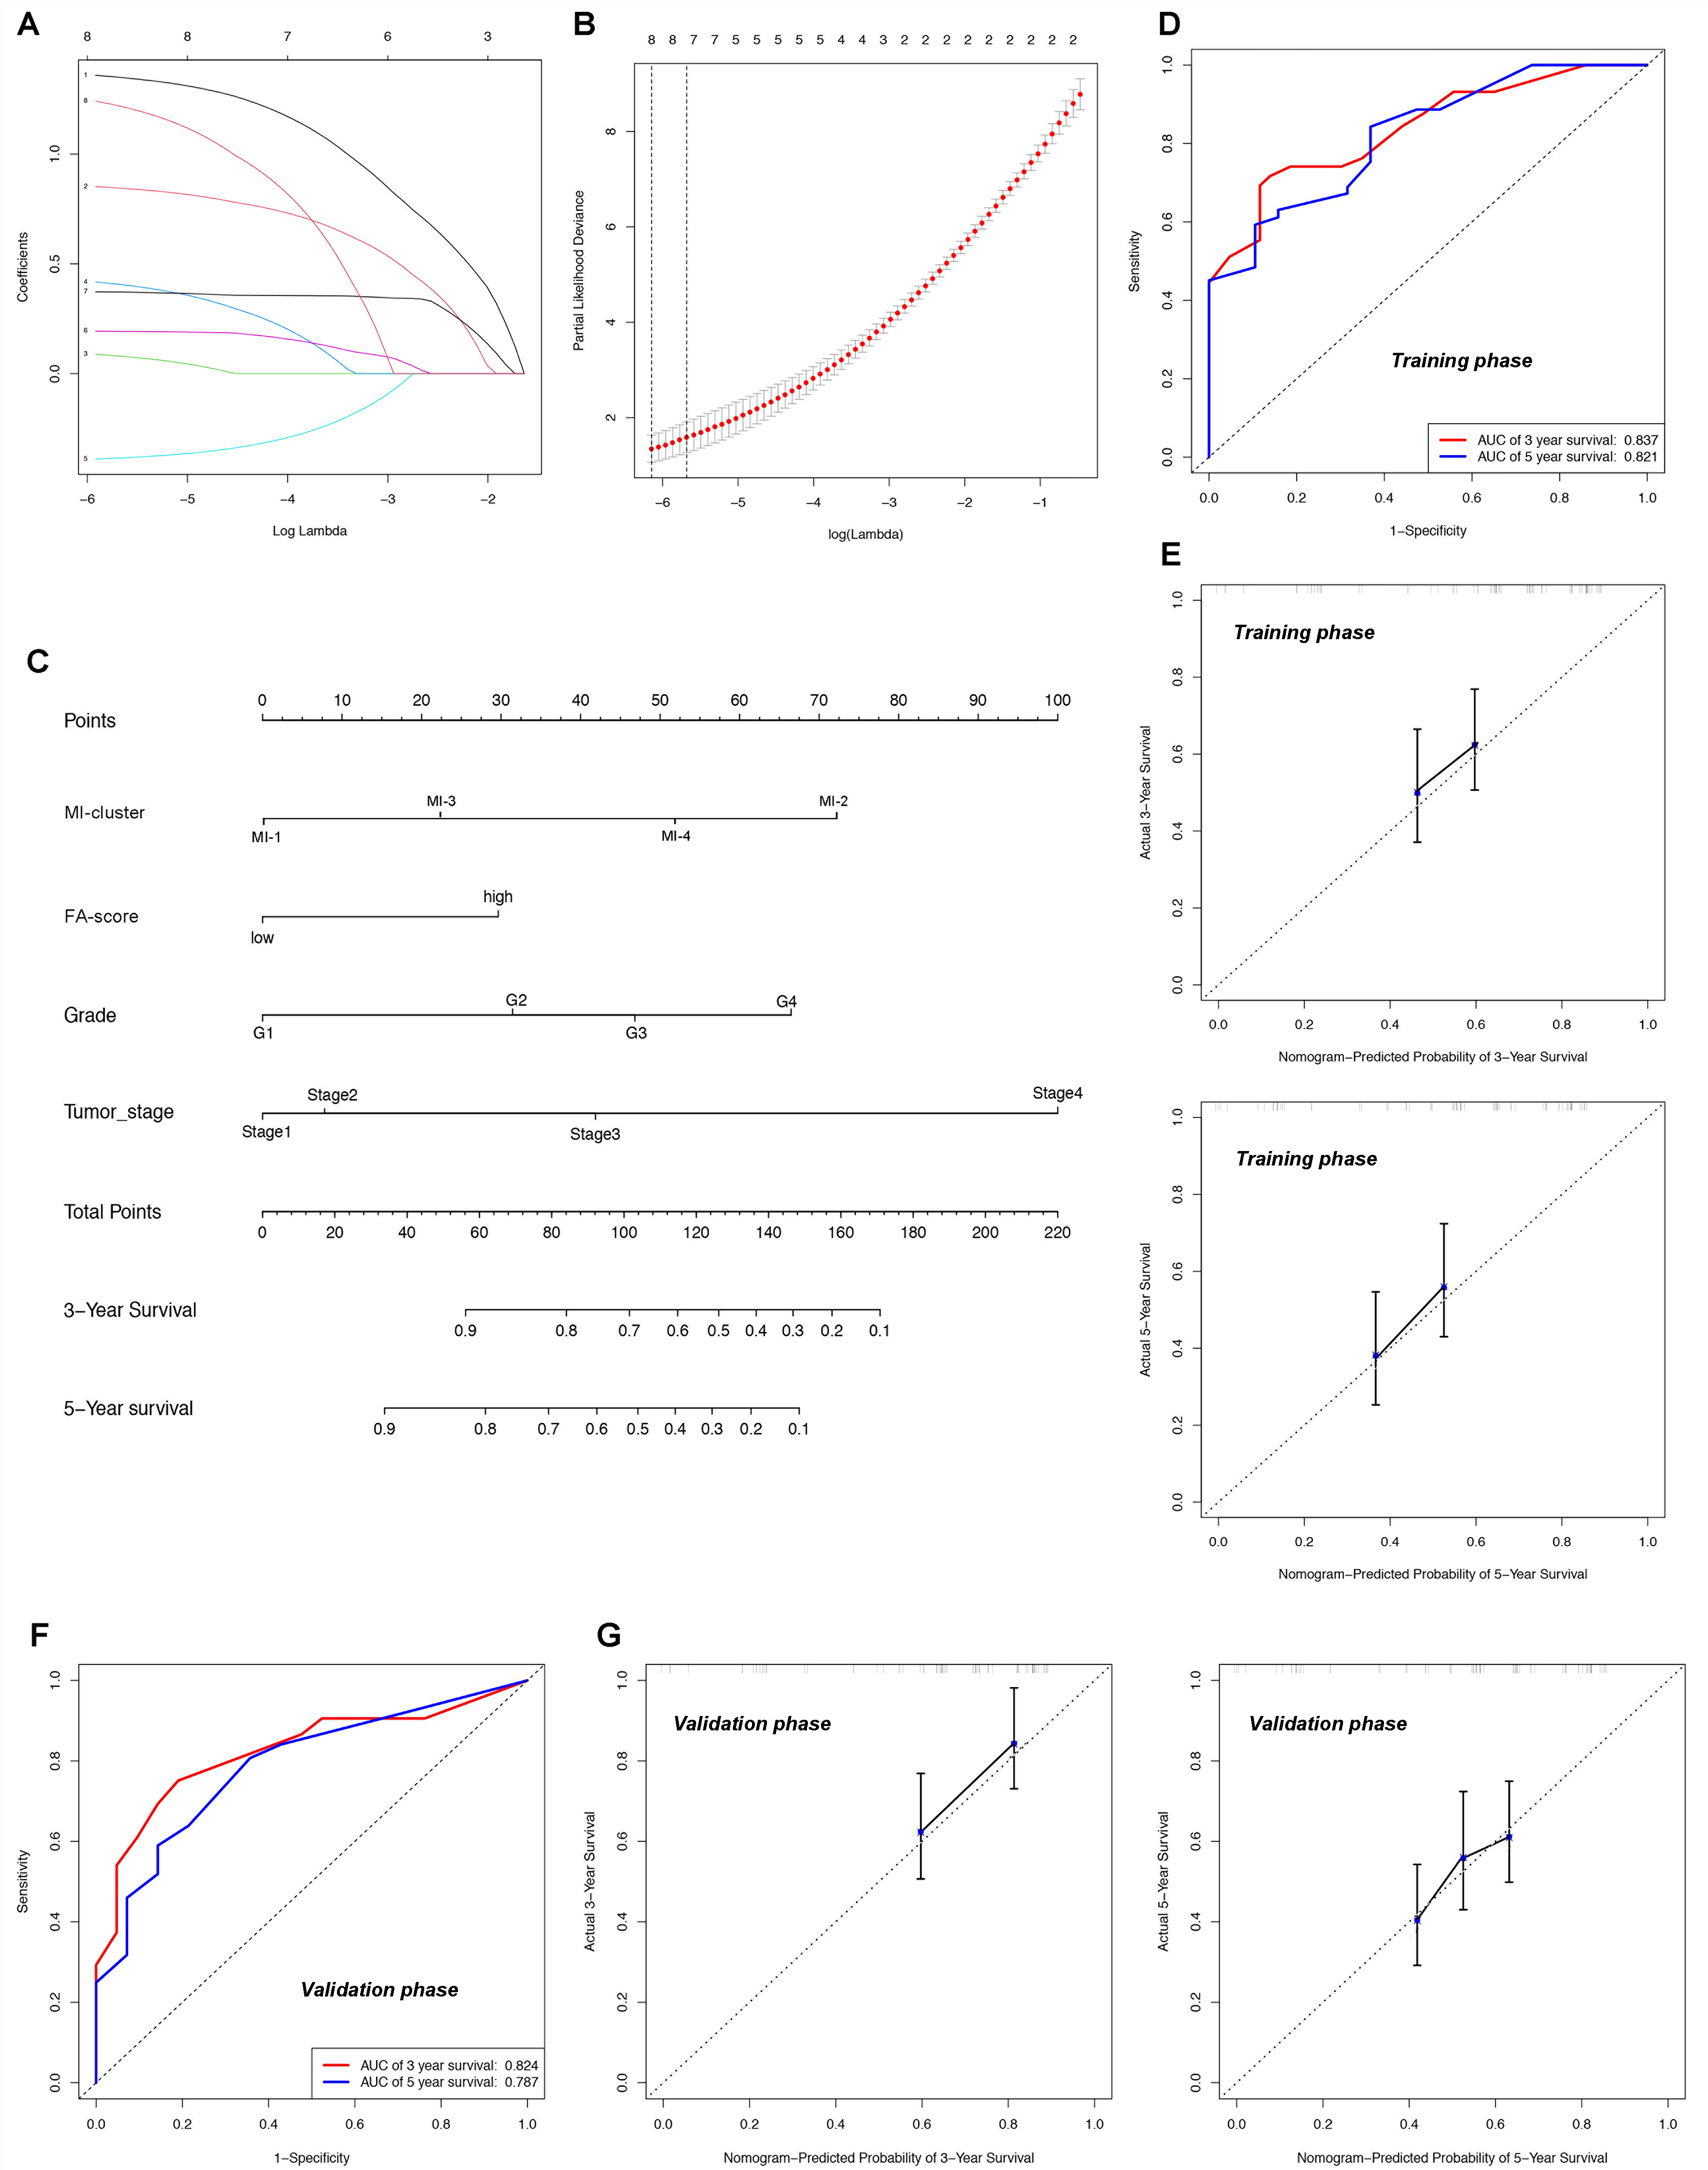
Figure 8. FA metabolism-associated nomogram for HCC patients. (A and B) LASSO regression identified four survival-related factors: MI clusters, FA_score, pathological grade, and TNM stage; (C) Nomogram for predicting 3-year and 5-year survival probabilities based on the multivariable Cox proportional hazards model; (D and E) AUROCs and calibration curves for 3-year and 5-year survival in the training group; (F and G) AUROCs and calibration curves for 3-year and 5-year survival in the validation group. FA: Fatty acid; HCC: hepatocellular carcinoma; MI: mixed index; TNM: tumor-node-metastasis; LASSO: least absolute shrinkage and selection operator; AUROC: areas under the ROC curve; ROC: receiver operating characteristic.
DISCUSSION
The hallmark features of malignancies, characterized by abnormal cellular growth and proliferation, are fueled by a substantial demand for energy. Among the intricate network of metabolic processes, reprogramming of FA metabolism has emerged as a key driver in the development of HCC[39,40]. Recent studies have confirmed the involvement of FA metabolism regulators, including receptor-interacting protein kinase 3 (RIPK3), in promoting inflammation and cancer development in MASLD[41-43]. Additionally, FA binding protein-4 (FABP4) has been implicated in promoting alcohol-dependent hepatosteatosis and HCC pathogenesis[44]. Cumulative evidence supports the notion that FA metabolism serves as a critical landscape in the progression of HCC.
In this study, we identified 42 FA metabolism-associated genes from the GSEA database. Utilizing HCC RNA-seq data from the TCGA database, we validated the expression levels of these genes in HCC samples and their noncancerous counterparts. We further analyzed CNVs and the mutation status of these FA regulators. Notably, ACAT2, CYP4A22, and ADH1B exhibited a high mutation frequency in HCC cases. Furthermore, we observed significant chromosomal gains in ALDH9A1, ACOX1, ECI2, CPT1A, and EHHADH, as well as frequent chromosomal losses in ACSL1, ACAT2, and ACADVL in tumor samples. Survival analysis revealed that 17 candidates could serve as prognostic biomarkers for HCC patients. Interestingly, we found that TP53 mutation could significantly influence the expression of most FA metabolism regulators, suggesting a regulatory role of TP53 in FA metabolism in HCC.
Although numerous studies have investigated the role of individual Regulators of FA metabolism in malignancies, the comprehensive contributions of FA metabolism in tumors have yet to be fully elucidated. Here, we aimed to assess the impact of FA metabolism on HCC by analyzing the transcriptional and genetic profiles of 42 FA metabolism-associated genes. Through integrative analysis, we classified the HCC cohort into two distinct clusters, denoted as FA cluster A and cluster B, which presented divergent clinical characteristics. Subsequently, we identified DEGs between these two clusters and developed an FA scoring system based on these FA-related DEGs. Strikingly, higher FA scores were associated with poorer prognosis and advanced TNM stage in HCC patients. Given the emerging evidence of metabolic modulation in shaping the TME, we further investigated whether FA metabolism could influence the immune response in HCC. Using the CIBERSORT algorithm, we discovered a positive correlation between FA scores and the recruitment of immunosuppressive cells in the TME. Moreover, the high FA score group displayed elevated expression levels of PD-L1, CD47, and CD24 compared to the low FA score group. These findings collectively suggest that FA metabolism has the potential to modulate the TME in HCC. Our study provides novel insights into the comprehensive impact of FA metabolism on HCC, highlighting its association with clinical outcomes and immune modulation within the TME. These findings may pave the way for the development of targeted therapeutic strategies harnessing FA metabolism in HCC treatment.
Cancer exerts profound effects on cellular metabolism, leading to the reshaping of intracellular metabolic pathways that facilitate inappropriate cell proliferation and adaptation to the TME. Moreover, it induces alterations in normal tissue metabolism. Each tumor type exhibits distinct metabolic characteristics, encompassing amino acid, lipid, and glucose metabolism, among others. Consequently, the identification of a novel immune classification specifically related to FA metabolism in HCC patients becomes imperative. Through the application of WGCNA and LASSO analysis, we identified 13 prognostic immune genes, which were employed to construct an immune risk prognostic model for HCC. Integrating FA scores and immune risk scores, we unveiled a sophisticated clustering system termed MI clustering (MI clusters 1-4). Notably, patients in MI-cluster-2 exhibited unfavorable OS outcomes and marked infiltration of suppressive immune cells within the TME. These findings emphasize the criticality of this clustering system in identifying HCC patients who may not be suitable for immunotherapy. Finally, we developed a nomogram incorporating FA scores and immune risk scores, demonstrating a high degree of concordance between predicted and observed probabilities in HCC patients.
Despite the robust performance of the FA_score and immune-risk predictive signatures in both internal training and validation cohorts, we acknowledge that the absence of external independent datasets and prospective clinical validation limits the immediate translational applicability of these models. In particular, validation in multi-center cohorts and in prospective clinical trial datasets with documented immunotherapy outcomes will be critical to fully establish their generalizability and clinical utility. Nevertheless, these validation steps are a primary focus of our ongoing research. We are currently initiating collaborations to acquire external multi-omics datasets and to embed the FA_score and immune risk signatures into future prospective studies, with the long-term goal of developing a clinically actionable tool that can guide individualized treatment decisions.
Recent evidence has demonstrated that dysregulated lipid and FA metabolism can reshape the tumor immune microenvironment by promoting oxidative stress, impairing antigen presentation, and driving T-cell dysfunction. Consistent with these mechanistic insights, our findings show that tumors with a high FA_score are enriched for immunosuppressive populations, including Tregs, MDSCs, and exhausted CD8⁺ T-cell subsets[27]. These features collectively suggest that FA metabolism-driven clustering may delineate a metabolically unfavorable immune state characterized by impaired cytotoxicity and enhanced immune tolerance. Such integration provides a biological rationale for the observed association between FA metabolic subtypes and differential patient outcomes, highlighting the potential of FA_score as a complementary tool for immune stratification.
Importantly, embedding this framework into established HCC surveillance paradigms requires alignment with widely used biomarkers such as alpha-fetoprotein (AFP) and des-γ-carboxy prothrombin (DCP). In the present study, inclusion of AFP and DCP in multivariate analyses where data were available demonstrated that FA_score provided additional prognostic information independent of conventional serum markers. These findings suggest that metabolic-immune phenotyping may enhance risk assessment beyond traditional biomarker-based screening. Nonetheless, prospective validation in clinically annotated cohorts - particularly those receiving immunotherapy - will be crucial to determine whether FA_score can improve early detection, refine monitoring strategies, or aid in predicting responsiveness to immune checkpoint blockade. Together, these results support the translational potential of integrating FA metabolism-related stratification with immune contexture and established clinical biomarkers in future HCC management frameworks.
While our study demonstrates significant correlations between FA metabolism signatures and immunosuppressive markers such as PD-L1, CD47, and CD24, the precise mechanisms linking FA metabolic activity to the recruitment and activation of immunosuppressive cells remain to be fully elucidated. Emerging evidence suggests that metabolites derived from FAs - including prostaglandins, lysophosphatidic acids, and oxidized lipid species - can modulate the expression of chemokines and cytokines, thereby promoting the accumulation of MDSCs and Tregs, and altering the functional state of CD4⁺ T cells. These metabolites may also engage specific immune receptors or signaling pathways, facilitating immune evasion within the TME. Integrating these mechanistic insights provides a biologically plausible explanation for the associations observed between high FA_score tumors and an immunosuppressive milieu. Nevertheless, we emphasize that these interpretations are currently hypothetical, and experimental studies are needed to validate the causal links between FA metabolic rewiring and immune suppression. Such investigations will be critical for translating FA metabolism-based stratification into clinically actionable biomarkers or therapeutic targets.
In the future study, our team will further concentrate on clarifying the molecular features of the patients in MI cluster-2. Moreover, we will try to find the interactions between FA metabolism and infiltrations of immune cells, which result in the suppressive TME construction of HCC.
Conclusion
Through our comprehensive analysis of the Regulators of FA metabolism in HCC samples, we constructed the FA metabolism-associated immune subtypes and the FA scoring system. Interestingly, we identified a special cohort: MI cluster-2. The HCC patients in this subtype presented a poor prognosis and high immunosuppressive characteristics. Utilizing the MI clustering system would be beneficial for us to choose the proper HCC populations that are suitable for immunotherapy.
DECLARATIONS
Authors’ contributions
Study conception and funding acquisition: Tang Z, Shi Y, Fan J, Zhou J
Experimental work and data collection: Chen D, Xu G, Fan A, Bu Y, Fang Y, Zhu GQ, Fu XT, Liu WR, Ding Z
Data analysis and result interpretation: Chen D, Xu G, Fan A
Manuscript drafting: Chen D, Xu G, Fan A
Takes primary responsibility for the final content: Tang Z
All authors reviewed and approved the final version of the manuscript.
Availability of data and materials
The raw data supporting the findings of this study are available within this Article and its Supplementary Materials. Further data are available from the corresponding authors upon request.
Financial support and sponsorship
This study was supported by Fudan University (Grant ID: IDF152090-152), the National Natural Science Foundation of China (Nos. 82003084, 82273386, 82273387, 82403408, 82403406, and 82403555), Shanghai Municipal Key Clinical Specialty, and the CAMS Innovation Fund for Medical Sciences (CIFMS; 2019-I2M-5-058), and the Zhongshan Hospital of Fudan University Hospital-level Project (Grant No. 2025ZSFZ05).
Conflicts of interest
Fan J is a Senior Advisory Editor of the journal Hepatoma Research, and Tang Z is a Junior Editorial Board Member of the journal. They were not involved in any steps of the editorial process, notably including reviewers’ selection, manuscript handling, or decision making. The other authors declare that there are no conflicts of interest.
Ethical approval and consent to participate
Not applicable.
Consent for publication
Not applicable.
Copyright
© The Author(s) 2026.
Supplementary Materials
REFERENCES
1. Xu F, Wu Q, Li L, Gong J, Huo R, Cui W. Icariside II: Anticancer Potential and Molecular Targets in Solid Cancers. Front Pharmacol. 2021;12:663776.
2. Daniel Y, Lelou E, Aninat C, Corlu A, Cabillic F. Interplay between metabolism reprogramming and epithelial-to-mesenchymal transition in cancer stem cells. Cancers. 2021;13:1973.
3. Dong S, Wu Y, Liu Y, Weng H, Huang H. N6 -methyladenosine steers RNA metabolism and regulation in cancer. Cancer Commun. 2021;41:538-59.
4. Zanotelli MR, Zhang J, Reinhart-King CA. Mechanoresponsive metabolism in cancer cell migration and metastasis. Cell Metab. 2021;33:1307-21.
5. Reina-Campos M, Scharping NE, Goldrath AW. CD8+ T cell metabolism in infection and cancer. Nat Rev Immunol. 2021;21:718-38.
6. Schmidt DR, Patel R, Kirsch DG, Lewis CA, Vander Heiden MG, Locasale JW. Metabolomics in cancer research and emerging applications in clinical oncology. CA Cancer J Clin. 2021;71:333-58.
7. Jin R, Hao J, Yi Y, Sauter E, Li B. Regulation of macrophage functions by FABP-mediated inflammatory and metabolic pathways. Biochim Biophys Acta Mol Cell Biol Lipids. 2021;1866:158964.
8. Singh A, Anjum B, Naz Q, et al. Night shift-induced circadian disruption: links to initiation of non-alcoholic fatty liver disease/non-alcoholic steatohepatitis and risk of hepatic cancer. Hepatoma Res. 2024;10:46.
9. DeRosa A, Leftin A. The iron curtain: macrophages at the interface of systemic and microenvironmental iron metabolism and immune response in cancer. Front Immunol. 2021;12:614294.
10. Jia D, Park JH, Kaur H, et al. Towards decoding the coupled decision-making of metabolism and epithelial-to-mesenchymal transition in cancer. Br J Cancer. 2021;124:1902-11.
11. Sobanski T, Rose M, Suraweera A, O’Byrne K, Richard DJ, Bolderson E. Cell metabolism and DNA repair pathways: implications for cancer therapy. Front Cell Dev Biol. 2021;9:633305.
12. Broadfield LA, Pane AA, Talebi A, Swinnen JV, Fendt SM. Lipid metabolism in cancer: new perspectives and emerging mechanisms. Dev Cell. 2021;56:1363-93.
13. Liu XZ, Pedersen L, Halberg N. Cellular mechanisms linking cancers to obesity. Cell Stress. 2021;5:55-72.
14. Moniri NH, Farah Q. Short-chain free-fatty acid G protein-coupled receptors in colon cancer. Biochem Pharmacol. 2021;186:114483.
15. Wang J, YangY
16. Tucci S, Alatibi KI, Wehbe Z. Altered metabolic flexibility in inherited metabolic diseases of mitochondrial fatty acid metabolism. Int J Mol Sci. 2021;22:3799.
17. Loomba R, Friedman SL, Shulman GI. Mechanisms and disease consequences of nonalcoholic fatty liver disease. Cell. 2021;184:2537-64.
18. Nosrati-Oskouie M, Aghili-Moghaddam NS, Sathyapalan T, Sahebkar A. Impact of curcumin on fatty acid metabolism. Phytother Res. 2021;35:4748-62.
19. Laval T, Chaumont L, Demangel C. Not too fat to fight: the emerging role of macrophage fatty acid metabolism in immunity to Mycobacterium tuberculosis. Immunol Rev. 2021;301:84-97.
20. Nagarajan SR, Butler LM, Hoy AJ. The diversity and breadth of cancer cell fatty acid metabolism. Cancer Metab. 2021;9:2.
21. Tse EK, Salehi A, Clemenzi MN, Belsham DD. Role of the saturated fatty acid palmitate in the interconnected hypothalamic control of energy homeostasis and biological rhythms. Am J Physiol Endocrinol Metab. 2018;315:E133-40.
22. Cruz-Gil S, Fernández LP, Sánchez-Martínez R, Gómez de Cedrón M, Ramírez de Molina A. Non-coding and regulatory RNAs as epigenetic remodelers of fatty acid homeostasis in cancer. Cancers. 2020;12:2890.
23. Pfister E, Smith R, Lane MA. N-3 polyunsaturated fatty acid ethyl esters decrease the invasion, but not the proliferation, of human colorectal cancer cells via a PI3K-dependent mechanism in vitro. Prostaglandins Leukot Essent Fatty Acids. 2021;167:102273.
24. Luo X, Zheng E, Wei L, et al. The fatty acid receptor CD36 promotes HCC progression through activating Src/PI3K/AKT axis-dependent aerobic glycolysis. Cell Death Dis. 2021;12:328.
25. Xu W, Lu Z, Wang X, et al. Gynura divaricata exerts hypoglycemic effects by regulating the PI3K/AKT signaling pathway and fatty acid metabolism signaling pathway. Nutr Diabetes. 2020;10:31.
26. Foerster F, Galle PR. The current landscape of clinical trials for systemic treatment of HCC. Cancers. 2021;13:1962.
27. Vogel A, Martinelli E; ESMO Guidelines Committee. Electronic address: clinicalguidelines@esmo.org, ESMO Guidelines Committee. Updated treatment recommendations for hepatocellular carcinoma (HCC) from the ESMO Clinical Practice Guidelines. Ann Oncol. 2021;32:801-5.
28. Reig M, Cabibbo G. Antiviral therapy in the palliative setting of HCC (BCLC-B and -C). J Hepatol. 2021;74:1225-33.
29. Zhong J, Kang Q, Cao Y, et al. BMP4 augments the survival of hepatocellular carcinoma (HCC) cells under hypoxia and hypoglycemia conditions by promoting the glycolysis pathway. Am J Cancer Res. 2021;11:793-811.
30. Li M, Shao J, Guo Z, et al. Novel mitochondrion-targeting copper(II) complex induces HK2 malfunction and inhibits glycolysis via Drp1-mediating mitophagy in HCC. J Cell Mol Med. 2020;24:3091-107.
31. Gao H, Hao Y, Zhou X, et al. Prognostic value of glucose transporter 3 expression in hepatocellular carcinoma. Oncol Lett. 2020;19:691-9.
32. Yu Z, Wang D, Tang Y. PKM2 promotes cell metastasis and inhibits autophagy via the JAK/STAT3 pathway in hepatocellular carcinoma. Mol Cell Biochem. 2021;476:2001-10.
33. Liu M, Yu X, Lin L, et al. ATGL promotes the proliferation of hepatocellular carcinoma cells via the p-AKT signaling pathway. J Biochem Mol Toxicol. 2019;33:e22391.
34. Yao J, Man S, Dong H, Yang L, Ma L, Gao W. Combinatorial treatment of Rhizoma Paridis saponins and sorafenib overcomes the intolerance of sorafenib. J Steroid Biochem Mol Biol. 2018;183:159-66.
35. Lally JSV, Ghoshal S, DePeralta DK, et al. Inhibition of Acetyl-CoA carboxylase by phosphorylation or the inhibitor ND-654 suppresses lipogenesis and hepatocellular carcinoma. Cell Metab. 2019;29:174-82.e5.
36. Laha D, Grant R, Mishra P, Nilubol N. The role of tumor necrosis factor in manipulating the immunological response of tumor microenvironment. Front Immunol. 2021;12:656908.
37. Ho WJ, Erbe R, Danilova L, et al. Multi-omic profiling of lung and liver tumor microenvironments of metastatic pancreatic cancer reveals site-specific immune regulatory pathways. Genome Biol. 2021;22:154.
38. Crafa F, Vanella S, Imperatore V. Laparoscopic total mesorectal excision for low rectal cancer with unilateral partial autonomic nerve preservation - a video vignette. Colorectal Dis. 2021;23:2205-6.
39. Tanaka M, Masaki Y, Tanaka K, et al. Reduction of fatty acid oxidation and responses to hypoxia correlate with the progression of de-differentiation in HCC. Mol Med Rep. 2013;7:365-70.
40. Heo CK, Woo MK, Yu DY, et al. Identification of autoantibody against fatty acid synthase in hepatocellular carcinoma mouse model and its application to diagnosis of HCC. Int J Oncol. 2010;36:1453-9.
41. Kim H, Lee DS, An TH, et al. Metabolic spectrum of liver failure in type 2 diabetes and obesity: from NAFLD to NASH to HCC. Int J Mol Sci. 2021;22:4495.
42. Longo M, Paolini E, Meroni M, Dongiovanni P. Remodeling of mitochondrial plasticity: the key switch from NAFLD/NASH to HCC. Int J Mol Sci. 2021;22:4173.
43. Myers S, Neyroud-Caspar I, Spahr L, et al. NAFLD and MAFLD as emerging causes of HCC: a populational study. JHEP Rep. 2021;3:100231.
Cite This Article
How to Cite
Download Citation
Export Citation File:
Type of Import
Tips on Downloading Citation
Citation Manager File Format
Type of Import
Direct Import: When the Direct Import option is selected (the default state), a dialogue box will give you the option to Save or Open the downloaded citation data. Choosing Open will either launch your citation manager or give you a choice of applications with which to use the metadata. The Save option saves the file locally for later use.
Indirect Import: When the Indirect Import option is selected, the metadata is displayed and may be copied and pasted as needed.
About This Article
Special Topic
Copyright

Data & Comments
Data
0


Comments
Comments must be written in English. Spam, offensive content, impersonation, and private information will not be permitted. If any comment is reported and identified as inappropriate content by OAE staff, the comment will be removed without notice. If you have any queries or need any help, please contact us at support@oaepublish.com.